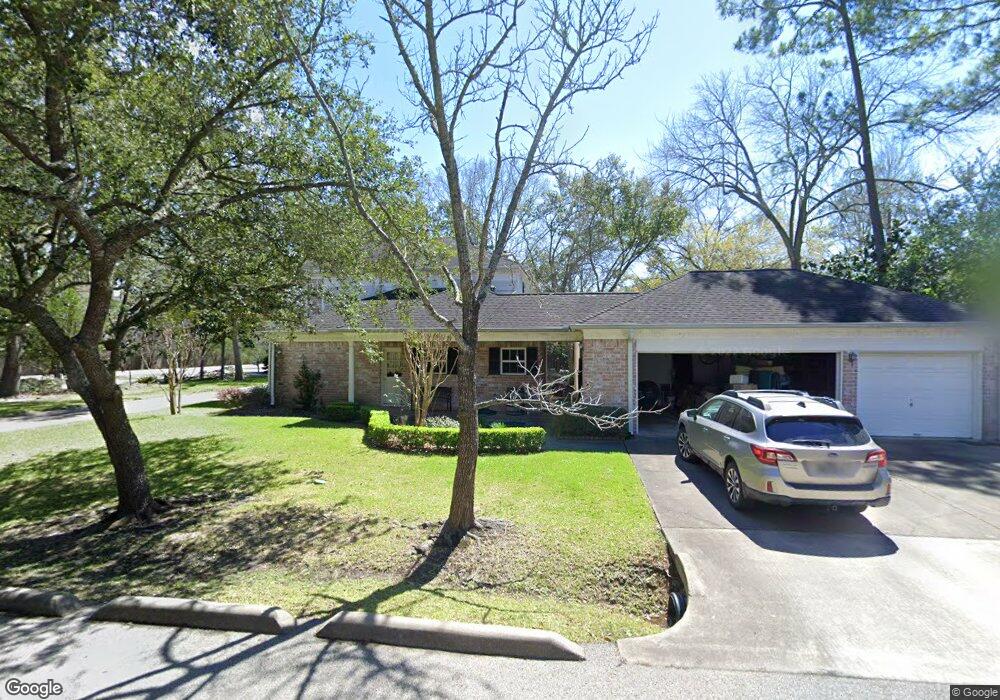
679 Strey Ln Houston, TX 77024
Estimated Value: $1,770,116 - $2,467,000
4
Beds
4
Baths
3,602
Sq Ft
$596/Sq Ft
Est. Value
About This Home
This home is located at 679 Strey Ln, Houston, TX 77024 and is currently estimated at $2,146,372, approximately $595 per square foot. 679 Strey Ln is a home located in Harris County with nearby schools including Bunker Hill Elementary School, Memorial Middle, and Memorial High School.
Ownership History
Date
Name
Owned For
Owner Type
Purchase Details
Closed on
May 6, 2021
Sold by
Farmer Harlow Grosvenor and Lian Nina Cecilie
Bought by
Farmer Harlow Grosvenor and Lian Nina Cecilie
Current Estimated Value
Purchase Details
Closed on
Aug 7, 2020
Sold by
Bejarano Amanda
Bought by
Mantzel Cassandra
Home Financials for this Owner
Home Financials are based on the most recent Mortgage that was taken out on this home.
Original Mortgage
$196,278
Outstanding Balance
$174,434
Interest Rate
3.1%
Mortgage Type
New Conventional
Estimated Equity
$1,971,938
Purchase Details
Closed on
Apr 25, 2019
Sold by
Sansing John W and Sansing June S
Bought by
Walker James K and Walker Mary E
Purchase Details
Closed on
Aug 8, 1998
Sold by
Ogan Roby D and Ogan Paula S
Bought by
Farmer Harlow G and Lian Nina C
Home Financials for this Owner
Home Financials are based on the most recent Mortgage that was taken out on this home.
Original Mortgage
$413,600
Interest Rate
6.94%
Purchase Details
Closed on
Sep 18, 1995
Sold by
Jones Lyn V and Merrill Lyn A
Bought by
Ogan Roby Donald and Ogan Paula Schwartz
Create a Home Valuation Report for This Property
The Home Valuation Report is an in-depth analysis detailing your home's value as well as a comparison with similar homes in the area
Home Values in the Area
Average Home Value in this Area
Purchase History
| Date | Buyer | Sale Price | Title Company |
|---|---|---|---|
| Farmer Harlow Grosvenor | -- | None Available | |
| Mantzel Cassandra | -- | American Title Co Dp | |
| Walker James K | -- | American Title Co Dp | |
| Farmer Harlow G | -- | Chicago Title | |
| Ogan Roby Donald | -- | Charter Title Company |
Source: Public Records
Mortgage History
| Date | Status | Borrower | Loan Amount |
|---|---|---|---|
| Open | Mantzel Cassandra | $196,278 | |
| Previous Owner | Farmer Harlow G | $413,600 |
Source: Public Records
Tax History Compared to Growth
Tax History
| Year | Tax Paid | Tax Assessment Tax Assessment Total Assessment is a certain percentage of the fair market value that is determined by local assessors to be the total taxable value of land and additions on the property. | Land | Improvement |
|---|---|---|---|---|
| 2025 | $16,109 | $1,397,655 | $1,023,621 | $374,034 |
| 2024 | $16,109 | $1,317,017 | $989,500 | $327,517 |
| 2023 | $16,109 | $1,246,324 | $938,319 | $308,005 |
| 2022 | $4,243 | $1,302,883 | $938,319 | $364,564 |
| 2021 | $27,900 | $1,281,683 | $939,323 | $342,360 |
| 2020 | $26,576 | $1,200,000 | $939,323 | $260,677 |
| 2019 | $28,718 | $1,245,000 | $939,323 | $305,677 |
| 2018 | $5,997 | $1,180,200 | $939,323 | $240,877 |
| 2017 | $26,162 | $1,199,000 | $939,323 | $259,677 |
| 2016 | $23,784 | $1,272,500 | $939,323 | $333,177 |
| 2015 | $16,043 | $1,283,700 | $939,323 | $344,377 |
| 2014 | $16,043 | $1,050,000 | $812,876 | $237,124 |
Source: Public Records
Map
Nearby Homes
- 601 Strey Ln
- 11910 Heritage Ln
- 12222 Broken Bough Dr
- 11933 Barryknoll Ln
- 12 Gage Ct
- 11905 Barryknoll Ln
- 12231 Kimberley Ln
- 12003 Tall Oaks St
- 711 Timber Hill Dr
- 12326 Old Oaks Dr
- 827 Bunker Hill Rd
- 939 Memorial Village Dr Unit 38
- 826 Bunker Hill Rd
- 11801 Barryknoll Ln
- 902 Memorial Village Dr Unit 66
- 12318 Queensbury Ln
- 12315 Barryknoll Ln
- 979 Memorial Village Dr Unit 48
- 11718 Broken Bough Cir
- 12406 Overcup Dr
- 675 Strey Ln
- 12007 Taylorcrest Ct
- 1 Huntington Park Ct
- 2 Huntington Park Ct
- 657 Strey Ln
- 8 Rain Hollow Place
- 12011 Taylorcrest Ct
- 661 Strey Ln
- 11934 Broken Bough Dr
- 4 Huntington Park Ct
- 3 Huntington Park Ct
- 7 Rain Hollow Place
- 12019 Taylorcrest Ct
- 653 Strey Ln
- 12015 Taylorcrest Ct
- 11930 Broken Bough Dr
- 659 Strey Ln
- 11930 Taylorcrest Rd
- 1 Huntington Park Cir
- 6 Rain Hollow Place