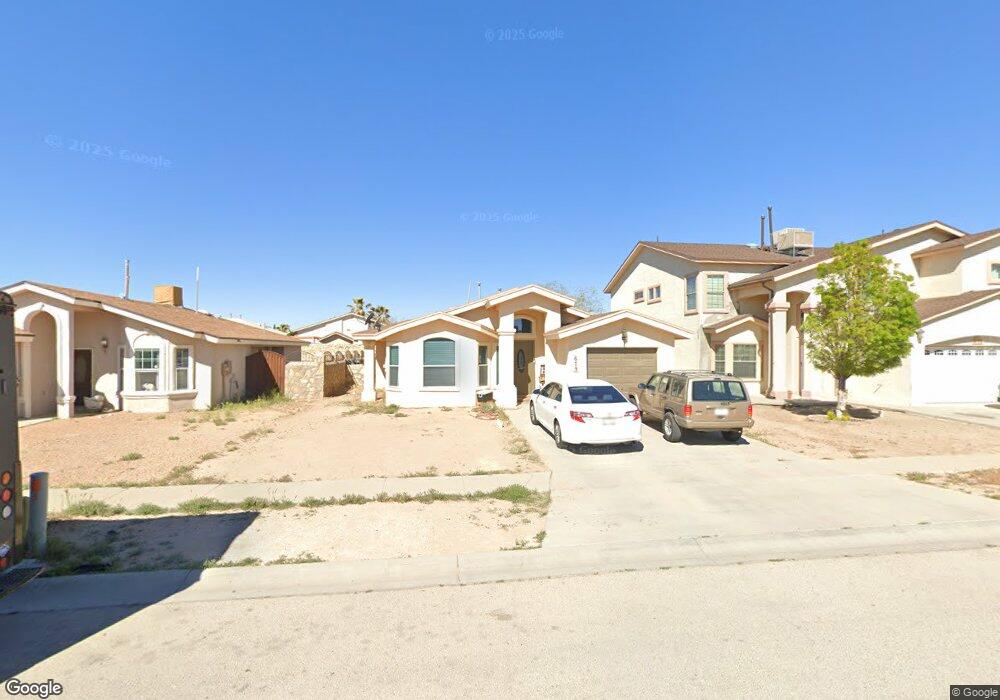
679 Teichelkamp Dr El Paso, TX 79928
Estimated Value: $202,362 - $224,000
4
Beds
2
Baths
1,528
Sq Ft
$142/Sq Ft
Est. Value
About This Home
This home is located at 679 Teichelkamp Dr, El Paso, TX 79928 and is currently estimated at $216,591, approximately $141 per square foot. 679 Teichelkamp Dr is a home located in El Paso County with nearby schools including Carroll T. Welch Elementary School, Ricardo Estrada Junior High School, and Horizon High School.
Ownership History
Date
Name
Owned For
Owner Type
Purchase Details
Closed on
Dec 8, 2011
Sold by
Cuartas Sergio L
Bought by
Hrp International Llc
Current Estimated Value
Home Financials for this Owner
Home Financials are based on the most recent Mortgage that was taken out on this home.
Original Mortgage
$78,400
Outstanding Balance
$53,964
Interest Rate
4.14%
Mortgage Type
Purchase Money Mortgage
Estimated Equity
$162,627
Purchase Details
Closed on
Dec 1, 2005
Sold by
Darrington Phase I J V
Bought by
Mi Casa Construction Llc
Home Financials for this Owner
Home Financials are based on the most recent Mortgage that was taken out on this home.
Original Mortgage
$24,500
Interest Rate
12%
Mortgage Type
Seller Take Back
Purchase Details
Closed on
Jun 27, 2005
Sold by
Ramirez Francisco A and Ramirez Socorro E
Bought by
Jv Darrington Phase I
Create a Home Valuation Report for This Property
The Home Valuation Report is an in-depth analysis detailing your home's value as well as a comparison with similar homes in the area
Home Values in the Area
Average Home Value in this Area
Purchase History
| Date | Buyer | Sale Price | Title Company |
|---|---|---|---|
| Hrp International Llc | -- | None Available | |
| Mi Casa Construction Llc | -- | -- | |
| Jv Darrington Phase I | -- | -- |
Source: Public Records
Mortgage History
| Date | Status | Borrower | Loan Amount |
|---|---|---|---|
| Open | Hrp International Llc | $78,400 | |
| Previous Owner | Mi Casa Construction Llc | $24,500 |
Source: Public Records
Tax History Compared to Growth
Tax History
| Year | Tax Paid | Tax Assessment Tax Assessment Total Assessment is a certain percentage of the fair market value that is determined by local assessors to be the total taxable value of land and additions on the property. | Land | Improvement |
|---|---|---|---|---|
| 2025 | $5,749 | $174,246 | $19,800 | $154,446 |
| 2024 | $5,749 | $179,041 | $19,800 | $159,241 |
| 2023 | $6,342 | $200,557 | $19,800 | $180,757 |
| 2022 | $4,377 | $135,000 | $17,028 | $117,972 |
| 2021 | $4,817 | $135,000 | $17,028 | $117,972 |
| 2020 | $3,619 | $104,178 | $17,028 | $87,150 |
| 2018 | $3,496 | $104,178 | $17,028 | $87,150 |
| 2017 | $3,014 | $90,774 | $16,236 | $74,538 |
| 2016 | $3,014 | $90,774 | $16,236 | $74,538 |
| 2015 | $3,181 | $98,250 | $16,236 | $82,014 |
| 2014 | $3,181 | $100,675 | $16,236 | $84,439 |
Source: Public Records
Map
Nearby Homes
- 671 Teichelkamp Dr
- 653 Villa Victoria Dr
- 648 Danube Dr
- 14475 Laureen Zelt Ct
- 14356 Rudi Kuefner Dr
- 14325 Rudi Kuefner Dr
- 14317 Rudi Kuefner Dr
- 708 Weiermann
- 14452 Corby Place
- 14413 Desierto Bello Ave
- 721 Maravillas St
- 14521 Achim
- 14559 Corby Place
- 14312 Desierto Bello Ave
- 14332 Desierto Bueno Ave
- 14309 Desierto Bueno Ave
- 14552 Annegret Dr
- 501 S Darrington Rd
- 14260 Desierto Lindo Ave
- 14257 Escalera Dr
- 675 Teichelkamp Dr
- 683 Teichelkamp Dr
- 687 Teichelkamp Dr
- 636 Desierto Bonito Ave
- 636 Desierto Bonito St
- 640 Desierto Bonito Ave
- 667 Teichelkamp Dr
- 632 Desierto Bonito Ave
- 14400 Schoenfelder Ln
- 644 Desierto Bonito Ave
- 691 Teichelkamp Dr
- 628 Desierto Bonito Ave
- 628 Desierto Bonito St
- 663 Teichelkamp Dr
- 648 Desierto Bonito Ave
- 648 Desierto Bonito Ave Unit 4
- 14404 Schoenfelder Ln
- 624 Desierto Bonito Ave
- 695 Teichelkamp Dr
- 690 Teichelkamp Dr