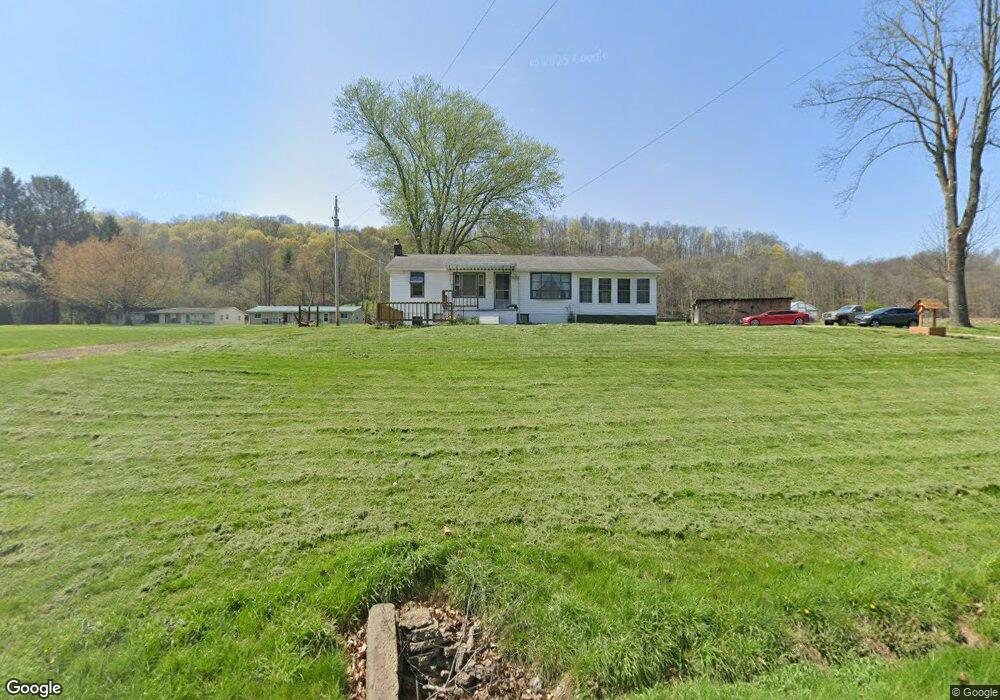
6795 N State Route 669 NW McConnelsville, OH 43756
Estimated Value: $160,000 - $195,000
4
Beds
2
Baths
1,260
Sq Ft
$140/Sq Ft
Est. Value
About This Home
This home is located at 6795 N State Route 669 NW, McConnelsville, OH 43756 and is currently estimated at $175,795, approximately $139 per square foot. 6795 N State Route 669 NW is a home located in Morgan County with nearby schools including Morgan High School.
Ownership History
Date
Name
Owned For
Owner Type
Purchase Details
Closed on
Sep 6, 2024
Sold by
Lewis Andrew V and Lewis Geri Ann
Bought by
Work Gary M and Work Margaret A
Current Estimated Value
Purchase Details
Closed on
Sep 22, 2017
Sold by
Kapust Michael A and Kapust Kelly E
Bought by
Lewis Andrew V
Home Financials for this Owner
Home Financials are based on the most recent Mortgage that was taken out on this home.
Original Mortgage
$97,042
Interest Rate
3.89%
Mortgage Type
VA
Purchase Details
Closed on
Oct 5, 2004
Sold by
Paige Kathleen A
Bought by
Kapust Michael A and Kapust Kelly E
Purchase Details
Closed on
Sep 8, 1992
Sold by
Tompkins William
Bought by
Tompkins William
Purchase Details
Closed on
Sep 1, 1992
Purchase Details
Closed on
Mar 20, 1992
Sold by
Tompkins William K
Bought by
Tompkins William
Create a Home Valuation Report for This Property
The Home Valuation Report is an in-depth analysis detailing your home's value as well as a comparison with similar homes in the area
Home Values in the Area
Average Home Value in this Area
Purchase History
| Date | Buyer | Sale Price | Title Company |
|---|---|---|---|
| Work Gary M | $150,000 | None Listed On Document | |
| Lewis Andrew V | $95,000 | None Available | |
| Kapust Michael A | $65,000 | -- | |
| Tompkins William | $54,500 | -- | |
| -- | $54,500 | -- | |
| Tompkins William | -- | -- |
Source: Public Records
Mortgage History
| Date | Status | Borrower | Loan Amount |
|---|---|---|---|
| Previous Owner | Lewis Andrew V | $97,042 |
Source: Public Records
Tax History Compared to Growth
Tax History
| Year | Tax Paid | Tax Assessment Tax Assessment Total Assessment is a certain percentage of the fair market value that is determined by local assessors to be the total taxable value of land and additions on the property. | Land | Improvement |
|---|---|---|---|---|
| 2024 | $1,382 | $43,740 | $6,800 | $36,940 |
| 2023 | $1,382 | $32,250 | $5,800 | $26,450 |
| 2022 | $1,010 | $32,250 | $5,800 | $26,450 |
| 2021 | $1,025 | $32,380 | $5,800 | $26,580 |
| 2019 | $922 | $27,850 | $5,040 | $22,810 |
| 2018 | $885 | $27,850 | $5,040 | $22,810 |
| 2017 | $668 | $20,682 | $2,835 | $17,847 |
| 2016 | $671 | $20,682 | $2,835 | $17,847 |
| 2015 | $670 | $20,682 | $2,835 | $17,847 |
| 2014 | $691 | $20,682 | $2,835 | $17,847 |
| 2013 | $678 | $20,682 | $2,835 | $17,847 |
Source: Public Records
Map
Nearby Homes
- 5975 Helaman Ln
- 3630 Leisure Dr NW
- 0 Leisure Dr NW Unit Lot 2
- 0 Leisure Dr NW Unit Lot 4
- Lot #2 Leisure Dr
- 8752 N Rokeby Dr NW
- 8627 N State Route 376 NW
- 9371 Mautz Dr
- 95 Sunset Dr
- 9911 N River Rd NW
- 774 N Kennebec Ave
- 0 Echo Hill Rd
- 284 N Kennebec Ave
- 262 N 5th St
- 160 S Main St
- 10185 Ohio 376
- 10112 S River Rd NW
- 10115 Old River Rd
- 8700 Rural Dale Rd
- 8960 State Route 37
- 6856 N State Route 669 NW
- 6870 S R 669 NW
- 6745 N State Route 669 NW
- 6886 N State Route 669 NW
- 6645 N State Route 669 NW
- 6890 N State Route 669 NW
- 6767 N State Route 60 NW
- 6785 N State Route 60 NW
- 6795 N State Route 60 NW
- 6697 N State Route 60 NW
- 6691 N State Route 60 NW
- 6625 Ohio 669
- 6762 N State Route 60 NW
- 6760 N State Route 60 NW
- 6772 Ohio 60
- 6827 N State Route 60 NW
- 6603 Ohio 669
- 6655 St Rt 60
- 6901 N State Route 60 NW
- 6603 N State Route 669 NW