68-3831 Lua Kula St Unit N101 Waikoloa, HI 96738
Estimated Value: $410,572 - $466,000
2
Beds
2
Baths
793
Sq Ft
$549/Sq Ft
Est. Value
About This Home
This home is located at 68-3831 Lua Kula St Unit N101, Waikoloa, HI 96738 and is currently estimated at $435,643, approximately $549 per square foot. 68-3831 Lua Kula St Unit N101 is a home located in Hawaii County with nearby schools including Waikoloa Elementary/Middle School and Kealakehe High School.
Ownership History
Date
Name
Owned For
Owner Type
Purchase Details
Closed on
Feb 15, 2006
Sold by
Pogue Rufus Lindsey and Estes Pogue Deanna June
Bought by
Pogue Rufus L and Estes Pogue Deanna
Current Estimated Value
Purchase Details
Closed on
Feb 14, 2003
Sold by
Dodge William Stuart and Sherba Dayle Karen
Bought by
Pogue Rufus Lindsey and Estes Pogue Deanna June
Home Financials for this Owner
Home Financials are based on the most recent Mortgage that was taken out on this home.
Original Mortgage
$108,000
Outstanding Balance
$46,186
Interest Rate
5.93%
Estimated Equity
$389,457
Purchase Details
Closed on
Oct 23, 1998
Sold by
Marks Bethany Van Siclen and Marks Diane L
Bought by
Dodge William Stuart and Sherba Dayle Karen
Home Financials for this Owner
Home Financials are based on the most recent Mortgage that was taken out on this home.
Original Mortgage
$66,800
Interest Rate
6.6%
Create a Home Valuation Report for This Property
The Home Valuation Report is an in-depth analysis detailing your home's value as well as a comparison with similar homes in the area
Home Values in the Area
Average Home Value in this Area
Purchase History
| Date | Buyer | Sale Price | Title Company |
|---|---|---|---|
| Pogue Rufus L | -- | Accommodation | |
| Pogue Rufus Lindsey | $135,000 | -- | |
| Dodge William Stuart | $83,500 | -- |
Source: Public Records
Mortgage History
| Date | Status | Borrower | Loan Amount |
|---|---|---|---|
| Open | Pogue Rufus Lindsey | $108,000 | |
| Previous Owner | Dodge William Stuart | $66,800 | |
| Closed | Dodge William Stuart | $8,350 |
Source: Public Records
Tax History Compared to Growth
Tax History
| Year | Tax Paid | Tax Assessment Tax Assessment Total Assessment is a certain percentage of the fair market value that is determined by local assessors to be the total taxable value of land and additions on the property. | Land | Improvement |
|---|---|---|---|---|
| 2025 | $228 | $184,500 | $29,400 | $155,100 |
| 2024 | $228 | $179,100 | $29,400 | $149,700 |
| 2023 | $302 | $173,900 | $29,400 | $144,500 |
| 2022 | $338 | $168,800 | $29,400 | $139,400 |
| 2021 | $314 | $163,900 | $29,400 | $134,500 |
| 2020 | $291 | $159,100 | $29,400 | $129,700 |
| 2019 | $268 | $154,500 | $29,400 | $125,100 |
| 2018 | $246 | $150,000 | $29,400 | $120,600 |
| 2017 | $224 | $145,600 | $29,400 | $116,200 |
| 2016 | $204 | $141,400 | $29,400 | $112,000 |
| 2015 | $308 | $137,300 | $29,400 | $107,900 |
| 2014 | $308 | $133,300 | $29,400 | $103,900 |
Source: Public Records
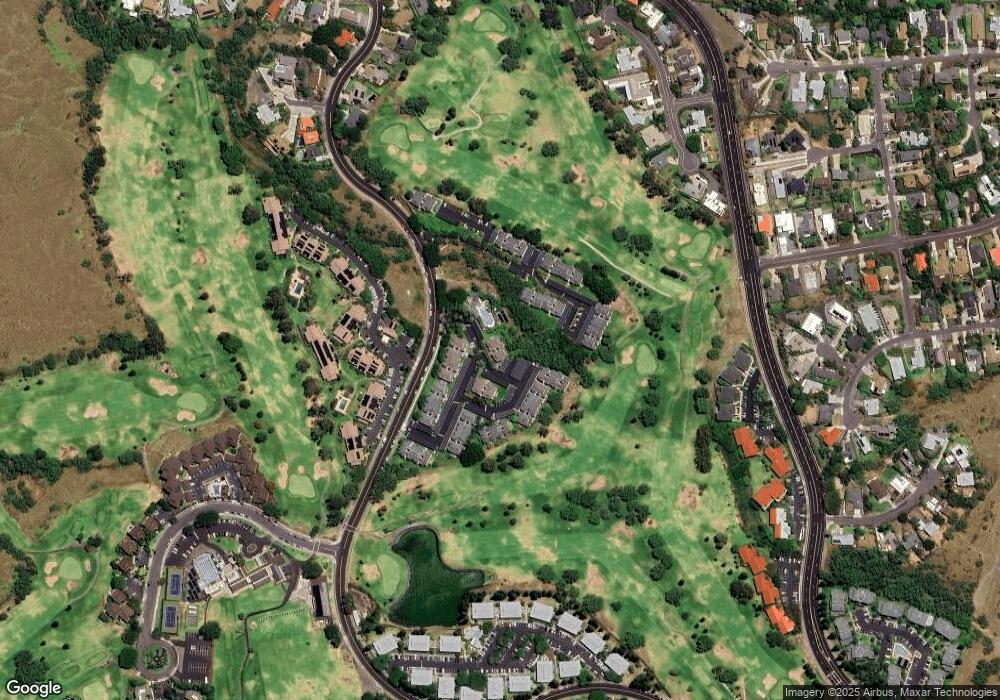
Map
Nearby Homes
- 68-3831 Lua Kula St Unit F207
- 68-3831 Lua Kula St Unit G203
- 68-3831 Lua Kula St Unit E102
- 68-3831 Lua Kula St Unit B102
- 68-3831 Lua Kula St Unit G207
- 68-3831 Lua Kula St Unit C107
- 68-3831 Lua Kula St Unit E203
- 68-3831 Lua Kula St Unit L107
- 68-3831 Lua Kula St Unit E202
- 68-3840 Lua Kula St Unit H100
- 68-3840 Lua Kula St Unit F203
- 68-3840 Lua Kula St Unit D201
- 68-3840 Lua Kula St Unit D200
- 68-3840 Lua Kula St Unit C200
- 68-3840 Lua Kula St Unit C205
- 68-6890 Paniolo Ave Unit 124
- 68-3883 Lua Kula St Unit 1906
- 68-3883 Lua Kula St Unit 2205
- 68-3883 Lua Kula St Unit 101
- 68-3883 Lua Kula St Unit 2005
- 68-3831 Lua Kula St Unit J101
- 68-3831 Lua Kula St Unit J101
- 68-3831 Lua Kula St Unit N204
- 68-3831 Lua Kula St Unit N203
- 68-3831 Lua Kula St Unit N202
- 68-3831 Lua Kula St Unit N201
- 68-3831 Lua Kula St Unit N103
- 68-3831 Lua Kula St Unit N102
- 68-3831 Lua Kula St Unit M208
- 68-3831 Lua Kula St Unit M207
- 68-3831 Lua Kula St Unit M206
- 68-3831 Lua Kula St Unit M205
- 68-3831 Lua Kula St Unit M204
- 68-3831 Lua Kula St Unit M203
- 68-3831 Lua Kula St Unit M202
- 68-3831 Lua Kula St Unit M201
- 68-3831 Lua Kula St Unit M108
- 68-3831 Lua Kula St Unit M107
- 68-3831 Lua Kula St Unit M106
- 68-3831 Lua Kula St Unit M105