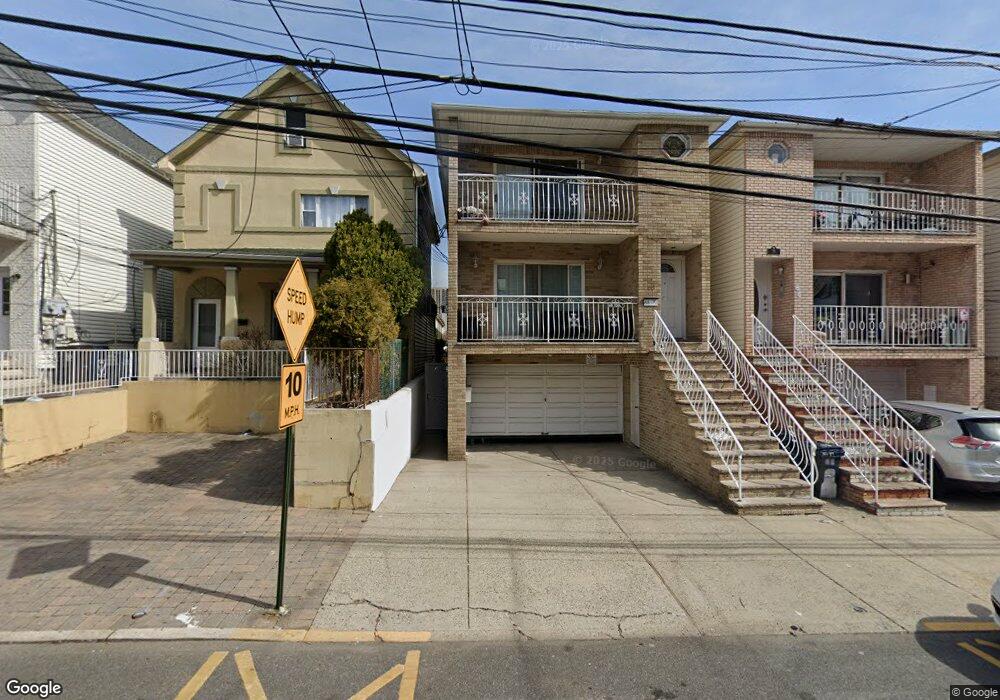
68 70th St Guttenberg, NJ 07093
Estimated Value: $938,000 - $1,266,000
8
Beds
5
Baths
2,916
Sq Ft
$374/Sq Ft
Est. Value
About This Home
This home is located at 68 70th St, Guttenberg, NJ 07093 and is currently estimated at $1,089,166, approximately $373 per square foot. 68 70th St is a home located in Hudson County with nearby schools including Anna L. Klein Elementary School and St. Joseph of the Palisades Elementary School.
Ownership History
Date
Name
Owned For
Owner Type
Purchase Details
Closed on
Sep 5, 2018
Sold by
Patel Yogesh and Patel Chetna
Bought by
Cheon Soona Britney
Current Estimated Value
Home Financials for this Owner
Home Financials are based on the most recent Mortgage that was taken out on this home.
Original Mortgage
$580,150
Outstanding Balance
$504,883
Interest Rate
4.5%
Mortgage Type
New Conventional
Estimated Equity
$584,283
Purchase Details
Closed on
Mar 30, 2001
Sold by
Sun Michael and Sun Claudia
Bought by
Patel Amritlal and Patel Yogesh
Home Financials for this Owner
Home Financials are based on the most recent Mortgage that was taken out on this home.
Original Mortgage
$304,000
Interest Rate
6.96%
Purchase Details
Closed on
Jul 11, 1994
Sold by
Padron Orestes
Bought by
Sun Michael and Sun Claudia
Home Financials for this Owner
Home Financials are based on the most recent Mortgage that was taken out on this home.
Original Mortgage
$238,000
Interest Rate
8.19%
Create a Home Valuation Report for This Property
The Home Valuation Report is an in-depth analysis detailing your home's value as well as a comparison with similar homes in the area
Home Values in the Area
Average Home Value in this Area
Purchase History
| Date | Buyer | Sale Price | Title Company |
|---|---|---|---|
| Cheon Soona Britney | $775,000 | Allied Title Llc | |
| Patel Yogesh | -- | Allied Title Llc | |
| Patel Amritlal | $380,000 | -- | |
| Sun Michael | $298,000 | -- |
Source: Public Records
Mortgage History
| Date | Status | Borrower | Loan Amount |
|---|---|---|---|
| Open | Cheon Soona Britney | $580,150 | |
| Previous Owner | Patel Amritlal | $304,000 | |
| Previous Owner | Sun Michael | $238,000 |
Source: Public Records
Tax History Compared to Growth
Tax History
| Year | Tax Paid | Tax Assessment Tax Assessment Total Assessment is a certain percentage of the fair market value that is determined by local assessors to be the total taxable value of land and additions on the property. | Land | Improvement |
|---|---|---|---|---|
| 2025 | $21,053 | $510,000 | $105,000 | $405,000 |
| 2024 | $20,369 | $510,000 | $105,000 | $405,000 |
| 2023 | $20,369 | $510,000 | $105,000 | $405,000 |
| 2022 | $19,773 | $510,000 | $105,000 | $405,000 |
| 2021 | $19,798 | $510,000 | $105,000 | $405,000 |
| 2020 | $19,691 | $510,000 | $105,000 | $405,000 |
| 2019 | $19,533 | $510,000 | $105,000 | $405,000 |
| 2018 | $19,008 | $510,000 | $105,000 | $405,000 |
| 2017 | $18,743 | $510,000 | $105,000 | $405,000 |
| 2016 | $20,389 | $558,600 | $105,000 | $453,600 |
| 2015 | $20,221 | $558,600 | $105,000 | $453,600 |
| 2014 | $19,774 | $558,600 | $105,000 | $453,600 |
Source: Public Records
Map
Nearby Homes
- 62 69th St Unit 503
- 61 69th St Unit C3
- 56 68th St Unit 8
- 56 68th St Unit . 8
- 56 68th St Unit 5
- 55 71st St
- 7100 Jfk Blvd E Unit 5E
- 7100 Jfk Blvd E Unit 2N
- 83 68th St Unit 3
- 7100 Boulevard E Unit 14 M
- 7100 Blvd E Unit 10P
- 7100 Blvd E Unit 2N
- 7100 Blvd E Unit 5E
- 7100 Blvd E Unit 14 D
- 7000 Boulevard E Unit 39F
- 7000 Boulevard E Unit 26K
- 7000 Jfk Blvd E Unit 33D
- 6701 Jfk Blvd E Unit E2
- 6701 Jfk Blvd E Unit E1
- 6701 Jfk Blvd E Unit C7
- 68 70th St Unit 1
- 68 70th St Unit 2
- 70 70th St
- 70 70th St Unit 1
- 66 70th St
- 66 70th St Unit 2
- 72 70th St
- 64 70th St Unit 64 70th St 2
- 64 70th St
- 64 70th St
- 64 70th St Unit 2
- 64 70th St Unit Ground Floor
- 64 70th St Unit 1
- 74 70th St
- 74 70th St Unit 2
- 62 70th St
- 62 70th St
- 62 70th St Unit 2
- 76 70th St
- 76 70th St Unit 1ST FLOOR