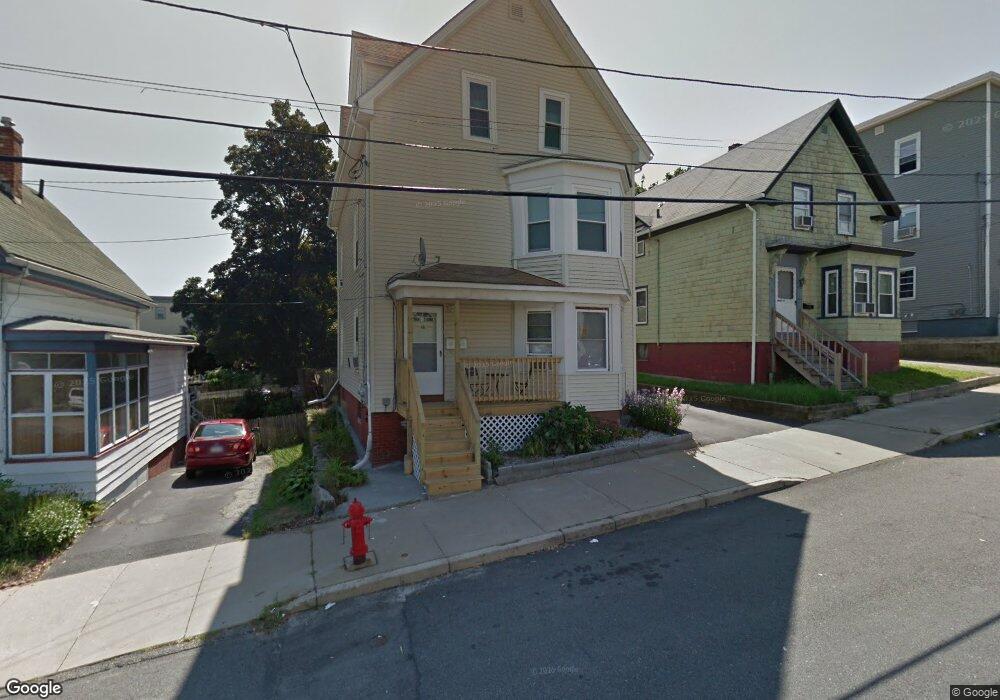
68 Adams St Lynn, MA 01902
Highlands NeighborhoodEstimated Value: $691,651 - $796,000
6
Beds
3
Baths
2,400
Sq Ft
$308/Sq Ft
Est. Value
About This Home
This home is located at 68 Adams St, Lynn, MA 01902 and is currently estimated at $739,663, approximately $308 per square foot. 68 Adams St is a home located in Essex County with nearby schools including Robert L. Ford Elementary School, William R. Fallon School, and Marshall Middle School.
Ownership History
Date
Name
Owned For
Owner Type
Purchase Details
Closed on
Nov 1, 2002
Sold by
Bernardino Rosa K
Bought by
Odion Becky E
Current Estimated Value
Home Financials for this Owner
Home Financials are based on the most recent Mortgage that was taken out on this home.
Original Mortgage
$277,100
Outstanding Balance
$112,288
Interest Rate
6.09%
Mortgage Type
Purchase Money Mortgage
Estimated Equity
$627,375
Purchase Details
Closed on
Oct 31, 2000
Sold by
68 Adams St Rt and Johnson Donald G
Bought by
Bernardino Rosa K and Perez Mitchellie
Purchase Details
Closed on
Sep 13, 1995
Sold by
Perry James R
Bought by
Johnson Donald G and Johnson Melinda
Purchase Details
Closed on
May 6, 1993
Sold by
Est Ira F Slate and Eldridge Barbara
Bought by
Perry James R
Create a Home Valuation Report for This Property
The Home Valuation Report is an in-depth analysis detailing your home's value as well as a comparison with similar homes in the area
Home Values in the Area
Average Home Value in this Area
Purchase History
| Date | Buyer | Sale Price | Title Company |
|---|---|---|---|
| Odion Becky E | $326,000 | -- | |
| Odion Becky E | $326,000 | -- | |
| Bernardino Rosa K | $190,000 | -- | |
| Bernardino Rosa K | $190,000 | -- | |
| Johnson Donald G | $25,000 | -- | |
| Johnson Donald G | $25,000 | -- | |
| Perry James R | $25,000 | -- | |
| Perry James R | $25,000 | -- |
Source: Public Records
Mortgage History
| Date | Status | Borrower | Loan Amount |
|---|---|---|---|
| Open | Perry James R | $277,100 | |
| Closed | Perry James R | $277,100 |
Source: Public Records
Tax History
| Year | Tax Paid | Tax Assessment Tax Assessment Total Assessment is a certain percentage of the fair market value that is determined by local assessors to be the total taxable value of land and additions on the property. | Land | Improvement |
|---|---|---|---|---|
| 2025 | $7,132 | $688,436 | $193,200 | $495,236 |
| 2024 | $6,661 | $632,600 | $174,400 | $458,200 |
| 2023 | $6,694 | $600,400 | $174,400 | $426,000 |
| 2022 | $6,680 | $537,400 | $142,600 | $394,800 |
| 2021 | $6,277 | $481,700 | $130,100 | $351,600 |
| 2020 | $5,550 | $414,200 | $101,600 | $312,600 |
| 2019 | $5,427 | $379,500 | $99,100 | $280,400 |
| 2018 | $5,030 | $332,000 | $95,800 | $236,200 |
| 2017 | $4,680 | $300,000 | $74,400 | $225,600 |
| 2016 | $4,236 | $261,800 | $62,700 | $199,100 |
| 2015 | $4,084 | $243,800 | $67,300 | $176,500 |
Source: Public Records
Map
Nearby Homes
Your Personal Tour Guide
Ask me questions while you tour the home.