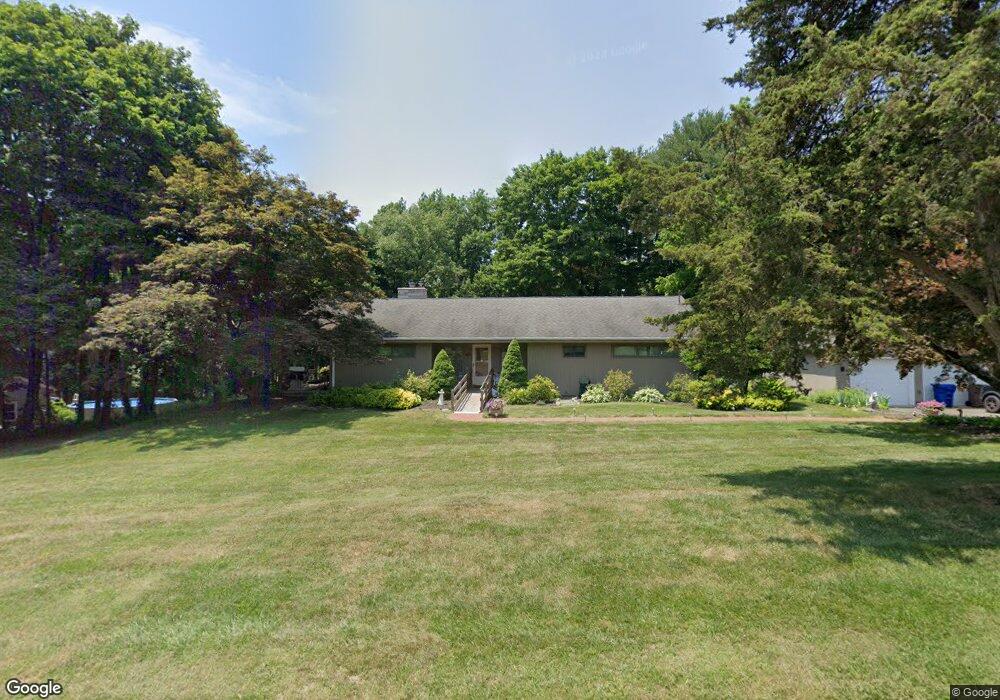
68 Alling Rd Northford, CT 06472
Estimated Value: $517,000 - $551,000
3
Beds
2
Baths
1,875
Sq Ft
$283/Sq Ft
Est. Value
About This Home
This home is located at 68 Alling Rd, Northford, CT 06472 and is currently estimated at $530,386, approximately $282 per square foot. 68 Alling Rd is a home located in New Haven County with nearby schools including Jerome Harrison School, Totoket Valley Elementary School, and North Branford Intermediate School.
Ownership History
Date
Name
Owned For
Owner Type
Purchase Details
Closed on
Aug 11, 2023
Sold by
Derosa Alfred
Bought by
Eileen A Derosa T A and Eileen Derosa
Current Estimated Value
Purchase Details
Closed on
Jan 6, 2011
Sold by
Derosa Nicholas and Derosa Eileen A
Bought by
Derosa Tr Alfred and Derosa Lauren A
Create a Home Valuation Report for This Property
The Home Valuation Report is an in-depth analysis detailing your home's value as well as a comparison with similar homes in the area
Home Values in the Area
Average Home Value in this Area
Purchase History
| Date | Buyer | Sale Price | Title Company |
|---|---|---|---|
| Eileen A Derosa T A | -- | None Available | |
| Derosa Tr Alfred | -- | -- |
Source: Public Records
Tax History
| Year | Tax Paid | Tax Assessment Tax Assessment Total Assessment is a certain percentage of the fair market value that is determined by local assessors to be the total taxable value of land and additions on the property. | Land | Improvement |
|---|---|---|---|---|
| 2025 | $9,498 | $344,000 | $117,000 | $227,000 |
| 2024 | $7,693 | $214,100 | $97,500 | $116,600 |
| 2023 | $7,391 | $214,100 | $97,500 | $116,600 |
| 2022 | $7,115 | $214,100 | $97,500 | $116,600 |
| 2021 | $7,095 | $214,100 | $97,500 | $116,600 |
| 2020 | $7,065 | $210,400 | $91,100 | $119,300 |
| 2019 | $7,040 | $210,400 | $91,100 | $119,300 |
| 2018 | $7,025 | $210,400 | $91,100 | $119,300 |
| 2017 | $7,051 | $210,400 | $91,100 | $119,300 |
| 2016 | $6,729 | $210,400 | $91,100 | $119,300 |
| 2015 | $6,704 | $215,700 | $95,500 | $120,200 |
| 2014 | $6,454 | $215,700 | $95,500 | $120,200 |
Source: Public Records
Map
Nearby Homes
- 2 Farmington Dr
- 126 Cooke Rd
- 246 Reeds Gap Rd Unit 1D
- 245 Reeds Gap Rd
- 1877 Middletown Ave
- 24 Evergreen Rd
- 27 Tamarac Swamp Rd
- 16 Quigley Rd
- 22 Carlen Dr
- 35 Montgomery Rd
- 30 Mallard Ct Unit 30
- 412 Pilgrim Harbor
- 10 Pilgrim Harbor Unit C
- 3 Pilgrim Harbor Unit C
- 10 Pilgrim Harbor Unit D
- 40 Lombard Cir Unit 40
- 229 Woodhouse Ave
- 16 Putter Dr Unit 207S
- 21 Putter Dr Unit 303S
- 924 E Center St
Your Personal Tour Guide
Ask me questions while you tour the home.