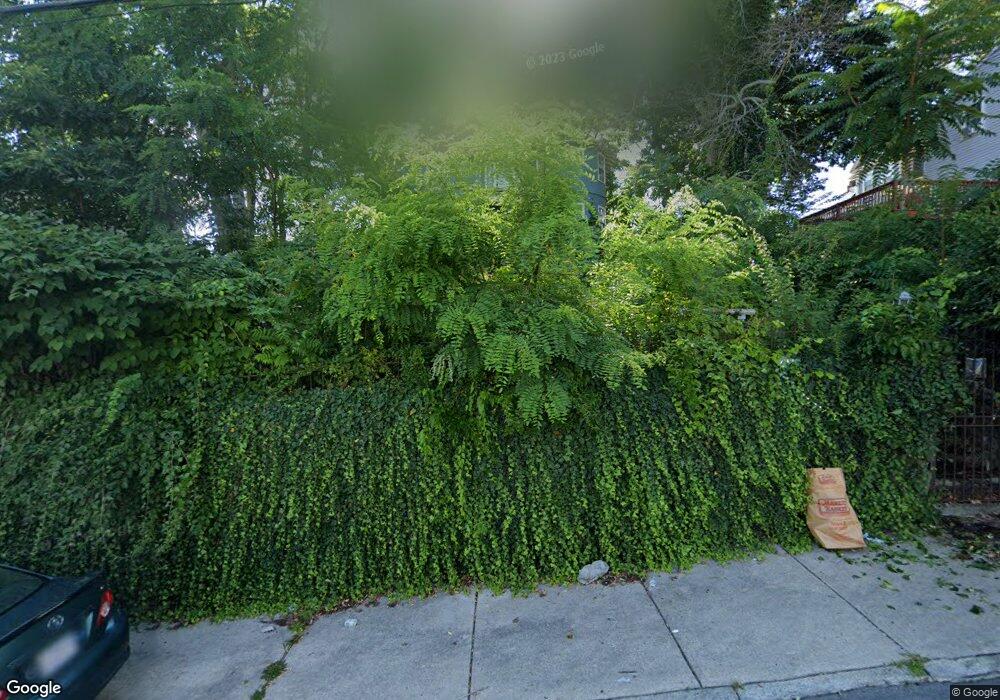
68 Ames St Lawrence, MA 01841
Tower Hill NeighborhoodEstimated Value: $560,000 - $916,000
4
Beds
2
Baths
2,812
Sq Ft
$252/Sq Ft
Est. Value
About This Home
This home is located at 68 Ames St, Lawrence, MA 01841 and is currently estimated at $707,782, approximately $251 per square foot. 68 Ames St is a home located in Essex County with nearby schools including Gerard A. Guilmette School, School For Exceptional Studies, and Lawrence Family Development Charter School.
Ownership History
Date
Name
Owned For
Owner Type
Purchase Details
Closed on
Jul 31, 2000
Sold by
Infante Carmen and Dominguez Jose A
Bought by
Augustin Joseph
Current Estimated Value
Home Financials for this Owner
Home Financials are based on the most recent Mortgage that was taken out on this home.
Original Mortgage
$151,050
Interest Rate
8.18%
Mortgage Type
Purchase Money Mortgage
Purchase Details
Closed on
Dec 29, 1999
Sold by
68 Ames Street Rt and Guselli Kathleen
Bought by
Dominguez Jose A
Home Financials for this Owner
Home Financials are based on the most recent Mortgage that was taken out on this home.
Original Mortgage
$139,929
Interest Rate
7.71%
Mortgage Type
Purchase Money Mortgage
Purchase Details
Closed on
Feb 4, 1987
Sold by
Bobco Ames St Rt
Bought by
Hatem Mark R
Create a Home Valuation Report for This Property
The Home Valuation Report is an in-depth analysis detailing your home's value as well as a comparison with similar homes in the area
Home Values in the Area
Average Home Value in this Area
Purchase History
| Date | Buyer | Sale Price | Title Company |
|---|---|---|---|
| Augustin Joseph | $159,000 | -- | |
| Dominguez Jose A | $140,000 | -- | |
| Hatem Mark R | $145,000 | -- |
Source: Public Records
Mortgage History
| Date | Status | Borrower | Loan Amount |
|---|---|---|---|
| Open | Hatem Mark R | $180,000 | |
| Closed | Hatem Mark R | $165,000 | |
| Closed | Hatem Mark R | $151,050 | |
| Previous Owner | Hatem Mark R | $139,929 |
Source: Public Records
Tax History
| Year | Tax Paid | Tax Assessment Tax Assessment Total Assessment is a certain percentage of the fair market value that is determined by local assessors to be the total taxable value of land and additions on the property. | Land | Improvement |
|---|---|---|---|---|
| 2025 | $4,762 | $541,100 | $140,800 | $400,300 |
| 2024 | $4,895 | $529,200 | $136,100 | $393,100 |
| 2023 | $4,818 | $474,200 | $119,200 | $355,000 |
| 2022 | $4,528 | $395,800 | $110,800 | $285,000 |
| 2021 | $4,373 | $356,400 | $110,800 | $245,600 |
| 2020 | $4,220 | $339,500 | $93,900 | $245,600 |
| 2019 | $4,383 | $320,400 | $81,300 | $239,100 |
| 2018 | $4,011 | $280,100 | $77,700 | $202,400 |
| 2017 | $3,942 | $257,000 | $75,000 | $182,000 |
| 2016 | $3,671 | $236,700 | $53,200 | $183,500 |
| 2015 | $3,579 | $236,700 | $53,200 | $183,500 |
Source: Public Records
Map
Nearby Homes
- 19 Oregon Ave
- 1008 Essex St Unit 1010
- 18 Doyle St
- 95 Hancock St
- 1082 Essex St
- 1100 Essex St
- 312 Water St Unit 4
- 1146 Essex St
- 70 Butler St
- 37 Tewksbury St Unit 39
- 42-44 Cypress Ave
- 15 Crescent St Unit D
- 499 Haverhill St
- 13 Caswell Ave
- 82 Water St
- 88-90 Columbus Ave
- 14-16 Cypress Ave
- 50 Forest St
- 543 Andover St Unit 6
- 91-93 Newton St
Your Personal Tour Guide
Ask me questions while you tour the home.