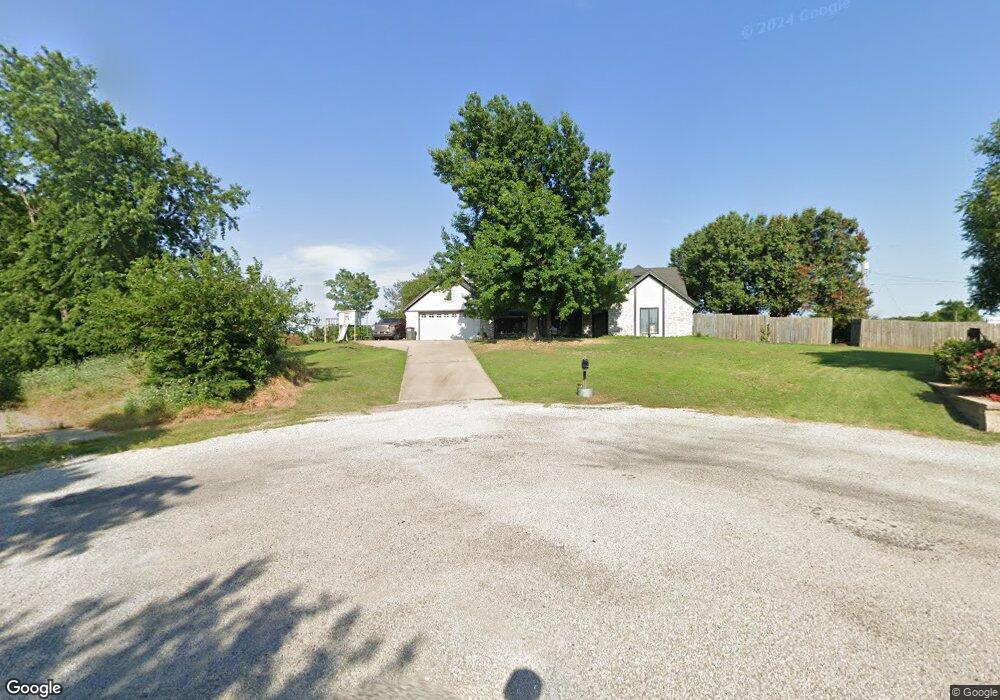
68 Bales Ln Ponca City, OK 74604
Estimated Value: $251,000 - $286,000
3
Beds
2
Baths
2,088
Sq Ft
$127/Sq Ft
Est. Value
About This Home
This home is located at 68 Bales Ln, Ponca City, OK 74604 and is currently estimated at $264,220, approximately $126 per square foot. 68 Bales Ln is a home located in Osage County with nearby schools including McCord Elementary School, St. Mary's Catholic School, and Ponca City Christian Academy.
Ownership History
Date
Name
Owned For
Owner Type
Purchase Details
Closed on
Aug 27, 2021
Sold by
Johnson Derrick and Johnson Christy
Bought by
Ferrill Robbie J and Ferrill Laura M
Current Estimated Value
Home Financials for this Owner
Home Financials are based on the most recent Mortgage that was taken out on this home.
Original Mortgage
$203,700
Outstanding Balance
$184,947
Interest Rate
2.8%
Mortgage Type
New Conventional
Estimated Equity
$79,273
Purchase Details
Closed on
Apr 15, 2016
Sold by
Kitchell Larry G and Kitchell Merry L
Bought by
Johnson Derrick and Johnson Christy
Purchase Details
Closed on
Jan 15, 2003
Sold by
Gmac Global Relocation Services Inc
Bought by
Kitchell Larry G
Purchase Details
Closed on
Oct 30, 2002
Sold by
Mazzoccoli Jeff C and Mazzoccoli Dana J
Bought by
Gmac Global Relocation Services~Inc
Purchase Details
Closed on
Aug 13, 1997
Sold by
Hines Patrick M
Bought by
Mazzoccoli Jeff C and Mazzoccoli Dana J
Create a Home Valuation Report for This Property
The Home Valuation Report is an in-depth analysis detailing your home's value as well as a comparison with similar homes in the area
Home Values in the Area
Average Home Value in this Area
Purchase History
| Date | Buyer | Sale Price | Title Company |
|---|---|---|---|
| Ferrill Robbie J | $210,000 | Security Title Service | |
| Johnson Derrick | $173,600 | Stewart Escrow & Title | |
| Kitchell Larry G | $134,500 | -- | |
| Gmac Global Relocation Services~Inc | $134,500 | -- | |
| Mazzoccoli Jeff C | $100,000 | -- |
Source: Public Records
Mortgage History
| Date | Status | Borrower | Loan Amount |
|---|---|---|---|
| Open | Ferrill Robbie J | $203,700 |
Source: Public Records
Tax History Compared to Growth
Tax History
| Year | Tax Paid | Tax Assessment Tax Assessment Total Assessment is a certain percentage of the fair market value that is determined by local assessors to be the total taxable value of land and additions on the property. | Land | Improvement |
|---|---|---|---|---|
| 2025 | $2,451 | $29,172 | $960 | $28,212 |
| 2024 | $2,451 | $27,783 | $960 | $26,823 |
| 2023 | $2,451 | $26,460 | $960 | $25,500 |
| 2022 | $2,210 | $25,200 | $960 | $24,240 |
| 2021 | $2,059 | $20,881 | $960 | $19,921 |
| 2020 | $2,067 | $20,881 | $960 | $19,921 |
| 2019 | $2,101 | $20,881 | $960 | $19,921 |
| 2018 | $1,758 | $20,881 | $960 | $19,921 |
| 2017 | $1,774 | $20,881 | $960 | $19,921 |
| 2016 | $1,735 | $20,377 | $960 | $19,417 |
| 2015 | $1,729 | $21,656 | $960 | $20,696 |
| 2014 | $1,700 | $21,025 | $960 | $20,065 |
| 2013 | $1,785 | $21,029 | $960 | $20,069 |
Source: Public Records
Map
Nearby Homes
- 2121 Kelley Ave
- 39 Raintree St
- 186 Moneytree Dr
- 158 Oakdale Rd
- 1493 Kelley Ave
- 297 N Mccord Rd
- 8 Riverview Dr
- 114 Park Place
- 866 Kelley Ave
- 0003 Glasgow Rd
- 0002 Glasgow Rd
- 0001 Glasgow Rd
- 4287 Lake Rd
- 500 Bell Rd
- 1001 S 9th St
- 909 S City View Rd
- 815 E Madison Ave
- 410 Drake Dr
- 1409 S 8th St
- 1300 S 8th St
- 67 Bales Ln
- 48 Bales Ln
- 47 Bales Ln
- 419 Whippoorwill Rd
- 2140 Kelley Ave
- 20 Bales Ln
- 19 Bales Ln
- 63574 Old Highway 60
- 401 Whippoorwill Rd
- 503 Whippoorwill Rd
- 16 Walker Rd
- 17 Walker Rd
- 381 Whippoorwill Rd
- 104 Candace Dr
- 476 Whippoorwill Rd
- 504 Whippoorwill Rd
- 366 Whippoorwill Rd
- 2223 Kelley Ave
- 351 Whippoorwill Rd
- 52 Walker Rd