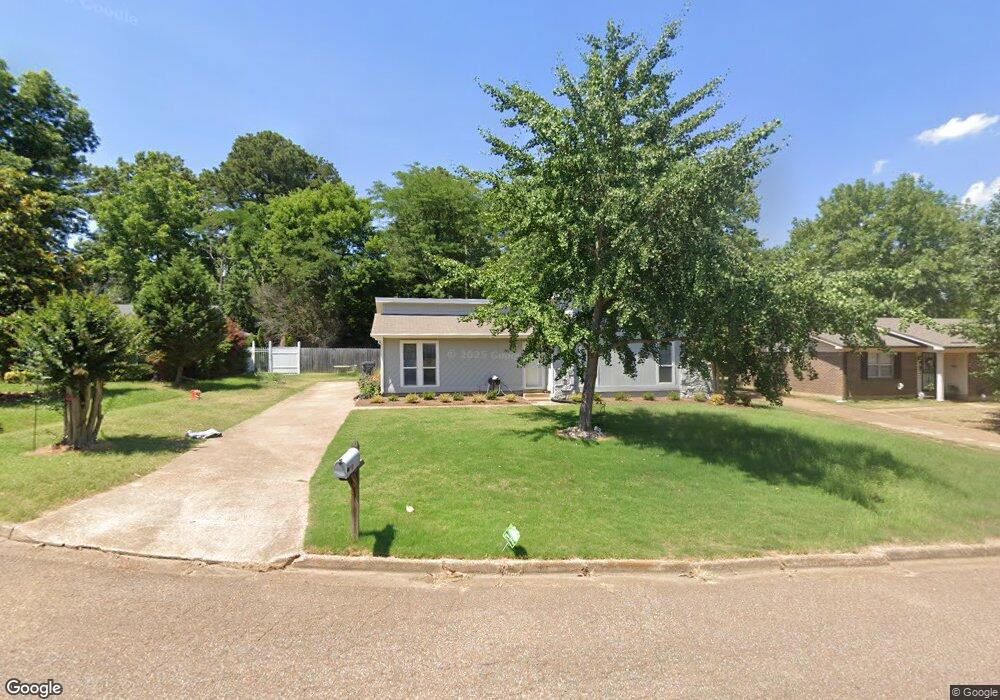
68 Bea Ave Hernando, MS 38632
Estimated Value: $191,345 - $231,000
3
Beds
--
Bath
1,282
Sq Ft
$169/Sq Ft
Est. Value
About This Home
This home is located at 68 Bea Ave, Hernando, MS 38632 and is currently estimated at $216,836, approximately $169 per square foot. 68 Bea Ave is a home located in DeSoto County with nearby schools including Oak Grove Central Elementary School, Hernando Elementary School, and Hernando Hills Elementary.
Ownership History
Date
Name
Owned For
Owner Type
Purchase Details
Closed on
Dec 21, 2023
Sold by
Simon James E and Simon Tanya M
Bought by
Hernandez Juan A Urrutia and Urrutia Maximo G
Current Estimated Value
Purchase Details
Closed on
Dec 17, 2010
Sold by
Aurora Loan Services Llc
Bought by
Secretary Of Housing & Urban Development
Purchase Details
Closed on
Oct 21, 2010
Sold by
Baddley Frank A
Bought by
Aurora Loan Services Llc
Create a Home Valuation Report for This Property
The Home Valuation Report is an in-depth analysis detailing your home's value as well as a comparison with similar homes in the area
Home Values in the Area
Average Home Value in this Area
Purchase History
| Date | Buyer | Sale Price | Title Company |
|---|---|---|---|
| Hernandez Juan A Urrutia | -- | Guardian Title | |
| Hernandez Juan A Urrutia | -- | Guardian Title | |
| Secretary Of Housing & Urban Development | -- | None Available | |
| Secretary Of Housing & Urban Development | -- | None Available | |
| Aurora Loan Services Llc | $47,025 | None Available | |
| Aurora Loan Services Llc | $47,025 | None Available |
Source: Public Records
Tax History
| Year | Tax Paid | Tax Assessment Tax Assessment Total Assessment is a certain percentage of the fair market value that is determined by local assessors to be the total taxable value of land and additions on the property. | Land | Improvement |
|---|---|---|---|---|
| 2025 | $809 | $8,442 | $1,500 | $6,942 |
| 2024 | $744 | $6,271 | $1,500 | $4,771 |
| 2023 | $744 | $9,407 | $0 | $0 |
| 2022 | $1,305 | $9,407 | $2,250 | $7,157 |
| 2021 | $1,305 | $9,407 | $2,250 | $7,157 |
| 2020 | $1,226 | $8,834 | $0 | $0 |
| 2019 | $1,226 | $8,834 | $2,250 | $6,584 |
| 2017 | $1,209 | $15,086 | $8,668 | $6,418 |
| 2016 | $1,158 | $8,668 | $2,250 | $6,418 |
| 2015 | $1,158 | $15,086 | $8,668 | $6,418 |
| 2014 | $1,131 | $8,668 | $0 | $0 |
| 2013 | $754 | $8,668 | $0 | $0 |
Source: Public Records
Map
Nearby Homes
- 1 E Oak Grove Rd
- 250 Vaiden Ridge Cove
- 186 E South St
- 187 Magnolia Gardens Dr
- 406 Vaiden Ridge Dr S
- 2948 Caffey St
- 5 W Commerce St
- 0 Southern St
- 101 E Valley St
- 244 Magnolia Gardens Dr
- 2615 Jaxon Dr
- 3524 Williams Brooke Ln
- 3758 Madison Ridge
- 0 E Commerce St
- 4770 Mccracken Rd
- 2035 Highway 51 S
- 313 Northwood Hills Dr
- 1038 W Oak Grove Rd
- 1335 Creekside Blvd
- 0 Monteith Ave Unit 4144041
Your Personal Tour Guide
Ask me questions while you tour the home.