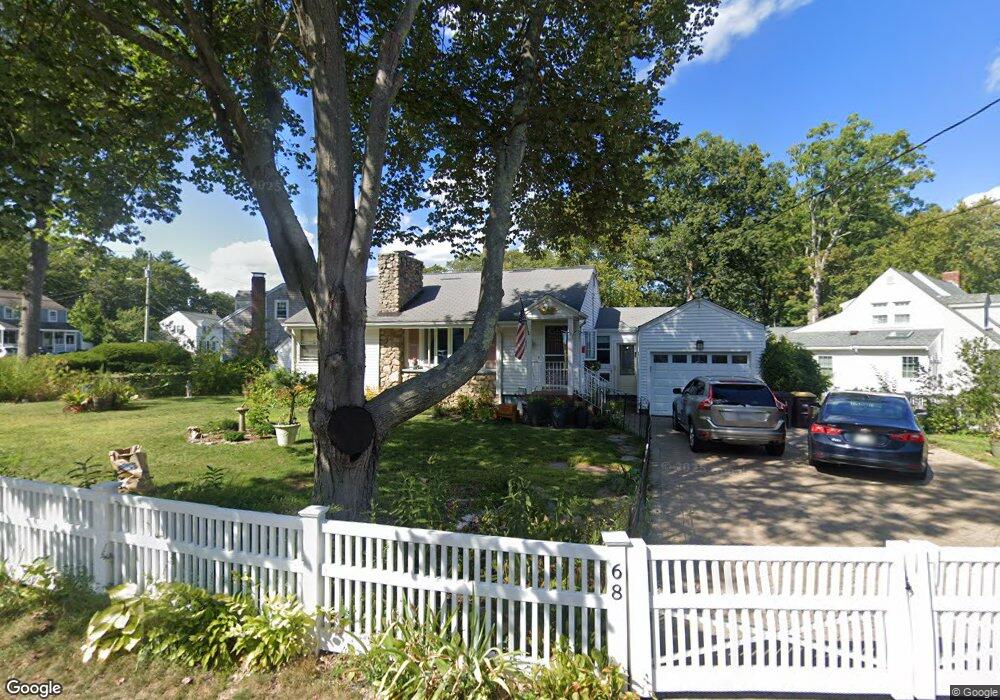
68 Belmont St Weymouth, MA 02188
South Weymouth NeighborhoodEstimated Value: $553,609 - $761,000
2
Beds
2
Baths
870
Sq Ft
$716/Sq Ft
Est. Value
About This Home
This home is located at 68 Belmont St, Weymouth, MA 02188 and is currently estimated at $623,152, approximately $716 per square foot. 68 Belmont St is a home located in Norfolk County with nearby schools including Frederick C Murphy, Abigail Adams Middle School, and Weymouth Middle School Chapman.
Ownership History
Date
Name
Owned For
Owner Type
Purchase Details
Closed on
Jul 30, 1999
Sold by
Anderson Gordon V and Anderson Marion B
Bought by
Derosa Richard A and Derosa Rosalind N
Current Estimated Value
Home Financials for this Owner
Home Financials are based on the most recent Mortgage that was taken out on this home.
Original Mortgage
$180,250
Outstanding Balance
$51,636
Interest Rate
7.61%
Mortgage Type
Purchase Money Mortgage
Estimated Equity
$571,516
Purchase Details
Closed on
Mar 1, 1991
Sold by
Goodwin Anna S
Bought by
Anderson Gordon V and Anderson Marion B
Create a Home Valuation Report for This Property
The Home Valuation Report is an in-depth analysis detailing your home's value as well as a comparison with similar homes in the area
Home Values in the Area
Average Home Value in this Area
Purchase History
| Date | Buyer | Sale Price | Title Company |
|---|---|---|---|
| Derosa Richard A | $175,000 | -- | |
| Anderson Gordon V | $110,000 | -- |
Source: Public Records
Mortgage History
| Date | Status | Borrower | Loan Amount |
|---|---|---|---|
| Open | Anderson Gordon V | $180,250 |
Source: Public Records
Tax History Compared to Growth
Tax History
| Year | Tax Paid | Tax Assessment Tax Assessment Total Assessment is a certain percentage of the fair market value that is determined by local assessors to be the total taxable value of land and additions on the property. | Land | Improvement |
|---|---|---|---|---|
| 2025 | $5,391 | $533,800 | $242,300 | $291,500 |
| 2024 | $5,166 | $503,000 | $230,800 | $272,200 |
| 2023 | $4,869 | $465,900 | $213,700 | $252,200 |
| 2022 | $4,576 | $399,300 | $181,400 | $217,900 |
| 2021 | $4,179 | $356,000 | $181,400 | $174,600 |
| 2020 | $3,916 | $328,500 | $181,400 | $147,100 |
| 2019 | $3,763 | $310,500 | $174,400 | $136,100 |
| 2018 | $3,656 | $292,500 | $166,100 | $126,400 |
| 2017 | $3,570 | $278,700 | $158,200 | $120,500 |
| 2016 | $3,252 | $254,100 | $152,200 | $101,900 |
| 2015 | $3,070 | $238,000 | $145,200 | $92,800 |
| 2014 | $2,983 | $224,300 | $135,200 | $89,100 |
Source: Public Records
Map
Nearby Homes
- 116 Belmont St
- 501 Commerce Dr Unit 2310
- 501 Commerce Dr Unit 1111
- 501 Commerce Dr Unit 4206
- 501 Commerce Dr Unit 4308
- 501 Commerce Dr Unit 4306
- 655 Summer St
- 200 Justin Dr Unit 3
- 255 West St
- 262 West St
- 92 Mercury St
- 432 Grove St
- 441 Grove St
- 48 Apple Tree Ln
- 2 Tara Dr Unit 1
- 972 Liberty St
- 54 Federal St
- 308 Forest St
- 24 Blake Rd
- 16 Jay Rd