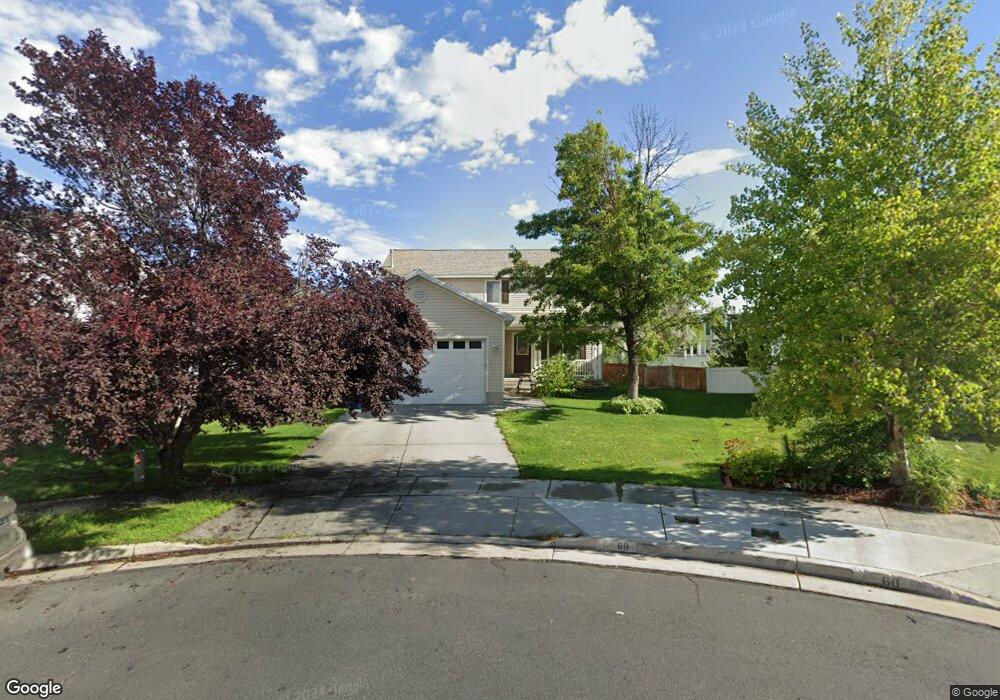
68 Bridge Cir Tooele, UT 84074
Estimated Value: $535,000 - $576,000
5
Beds
4
Baths
2,907
Sq Ft
$192/Sq Ft
Est. Value
About This Home
This home is located at 68 Bridge Cir, Tooele, UT 84074 and is currently estimated at $557,858, approximately $191 per square foot. 68 Bridge Cir is a home located in Tooele County with nearby schools including Stansbury Park Elementary School, Clarke N. Johnsen Junior High School, and Stansbury High School.
Ownership History
Date
Name
Owned For
Owner Type
Purchase Details
Closed on
Jul 15, 2024
Sold by
Bateeva Alesia and Loginov Vadym
Bought by
Bateeva Alesia
Current Estimated Value
Purchase Details
Closed on
Apr 19, 2022
Sold by
Charissa Ortega
Bought by
Bateeva Alesia and Loginov Vadym
Home Financials for this Owner
Home Financials are based on the most recent Mortgage that was taken out on this home.
Original Mortgage
$393,750
Interest Rate
5%
Mortgage Type
New Conventional
Purchase Details
Closed on
Nov 18, 2016
Sold by
Duersch Jarad and Duersch Janae
Bought by
Ortega Charissa
Home Financials for this Owner
Home Financials are based on the most recent Mortgage that was taken out on this home.
Original Mortgage
$272,964
Interest Rate
3.37%
Mortgage Type
FHA
Create a Home Valuation Report for This Property
The Home Valuation Report is an in-depth analysis detailing your home's value as well as a comparison with similar homes in the area
Home Values in the Area
Average Home Value in this Area
Purchase History
| Date | Buyer | Sale Price | Title Company |
|---|---|---|---|
| Bateeva Alesia | -- | None Listed On Document | |
| Bateeva Alesia | -- | Artisan Title | |
| Ortega Charissa | -- | Backman Fptp |
Source: Public Records
Mortgage History
| Date | Status | Borrower | Loan Amount |
|---|---|---|---|
| Previous Owner | Bateeva Alesia | $393,750 | |
| Previous Owner | Ortega Charissa | $272,964 |
Source: Public Records
Tax History Compared to Growth
Tax History
| Year | Tax Paid | Tax Assessment Tax Assessment Total Assessment is a certain percentage of the fair market value that is determined by local assessors to be the total taxable value of land and additions on the property. | Land | Improvement |
|---|---|---|---|---|
| 2025 | $4,262 | $538,728 | $184,800 | $353,928 |
| 2024 | $4,791 | $307,810 | $101,640 | $206,170 |
| 2023 | $4,791 | $295,152 | $100,320 | $194,832 |
| 2022 | $3,217 | $258,152 | $95,304 | $162,848 |
| 2021 | $2,637 | $174,757 | $66,943 | $107,814 |
| 2020 | $2,520 | $292,021 | $95,700 | $196,321 |
| 2019 | $2,458 | $280,173 | $95,700 | $184,473 |
| 2018 | $2,283 | $249,265 | $40,000 | $209,265 |
| 2017 | $2,072 | $239,300 | $40,000 | $199,300 |
| 2016 | $1,783 | $117,317 | $22,000 | $95,317 |
| 2015 | $1,783 | $111,922 | $0 | $0 |
| 2014 | -- | $111,922 | $0 | $0 |
Source: Public Records
Map
Nearby Homes
- 5975 Yachtsman Ln
- 122 Stern Ct
- 137 Stern Ct
- 62 Fairway Dr
- 5718 Lanyard Ln
- 5675 Lanyard Ln
- 5584 N Gentle Breeze Ct
- 107 Pebble Beach Dr
- 395 W Broome St
- 5943 N Bleeker St
- 133 W Marigold Cir Unit 311
- 138 W Morning Glory Cir
- 173 Lakeview Dr
- 789 Country Club Dr
- 5531 Ponderosa Ln
- 39 Strasbourg Ln
- 6142 N Schooner Ln
- 5546 Ardennes Way
- 45 W Streams Edge Way
- 485 Delancey St