Estimated Value: $174,000 - $260,000
3
Beds
2
Baths
1,094
Sq Ft
$196/Sq Ft
Est. Value
About This Home
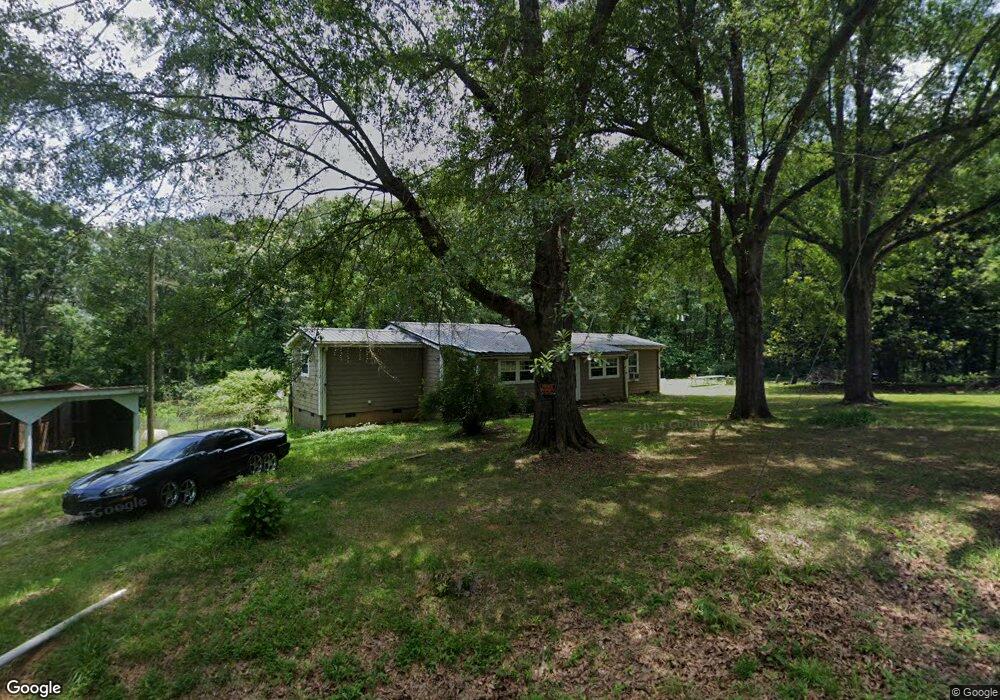
This home is located at 68 Bridges St Unit 48, Inman, SC 29349 and is currently estimated at $213,974, approximately $195 per square foot. 68 Bridges St Unit 48 is a home located in Spartanburg County with nearby schools including Inman Elementary School, T.E. Mabry Middle School, and Chapman High School.
Ownership History
Date
Name
Owned For
Owner Type
Purchase Details
Closed on
Jun 19, 2014
Sold by
Smith David D
Bought by
Barajas Rafael
Current Estimated Value
Home Financials for this Owner
Home Financials are based on the most recent Mortgage that was taken out on this home.
Original Mortgage
$85,448
Outstanding Balance
$64,969
Interest Rate
4.19%
Mortgage Type
New Conventional
Estimated Equity
$149,005
Create a Home Valuation Report for This Property
The Home Valuation Report is an in-depth analysis detailing your home's value as well as a comparison with similar homes in the area
Home Values in the Area
Average Home Value in this Area
Purchase History
| Date | Buyer | Sale Price | Title Company |
|---|---|---|---|
| Barajas Rafael | $83,740 | -- |
Source: Public Records
Mortgage History
| Date | Status | Borrower | Loan Amount |
|---|---|---|---|
| Open | Barajas Rafael | $85,448 |
Source: Public Records
Tax History Compared to Growth
Tax History
| Year | Tax Paid | Tax Assessment Tax Assessment Total Assessment is a certain percentage of the fair market value that is determined by local assessors to be the total taxable value of land and additions on the property. | Land | Improvement |
|---|---|---|---|---|
| 2025 | $1,228 | $5,347 | $2,080 | $3,267 |
| 2024 | $1,228 | $5,347 | $2,080 | $3,267 |
| 2023 | $1,228 | $5,347 | $2,080 | $3,267 |
| 2022 | $1,361 | $5,200 | $2,194 | $3,006 |
| 2021 | $1,361 | $5,200 | $2,194 | $3,006 |
| 2020 | $1,344 | $5,200 | $2,194 | $3,006 |
| 2019 | $1,344 | $5,200 | $2,194 | $3,006 |
| 2018 | $1,344 | $5,200 | $2,194 | $3,006 |
| 2017 | $1,291 | $4,960 | $2,194 | $2,766 |
| 2016 | $1,291 | $4,960 | $2,194 | $2,766 |
| 2015 | $1,286 | $4,960 | $2,194 | $2,766 |
| 2014 | $948 | $3,622 | $1,602 | $2,020 |
Source: Public Records
Map
Nearby Homes
- 102 Gary Dr
- 140 Golightly St
- 00 Bomar St
- 42 Bishop St
- 0 Johnson Ave
- 125 Old Clark Rd
- 8 Bobo St
- 14 Littlefield St
- 7 Lawrence St
- 155 Wingo St
- 135 Glendarosa Dr
- 9038 Legendary Ln
- 345 Bishop Hicks Ct
- 00 Clark Rd
- 3014 Gabriela Way
- 119 Beechwood Dr
- 309 Misty Meadows Ln
- 28 Blackstock Rd
- 41 Gosnell Ave
- 704 Adaline Dr
- 48 Bridges St
- 43 Bridges St
- 42 Bridges St
- 41 Bridges St
- 0 Weaver Line
- 45 Bridges St
- 2 Powell Cir
- 39 Bridges St
- 38 Bridges St
- 4 Powell Cir
- 12 Bluebird Ln
- 10 Bluebird Ln
- 3 Powell Cir
- 288 Bridges St Unit 280
- 5 Powell Cir
- 8 Powell Cir
- 190 Weaver Line Unit B
- 190 Weaver Line Unit A
- 11 Bluebird Ln
- 34 Bridges St