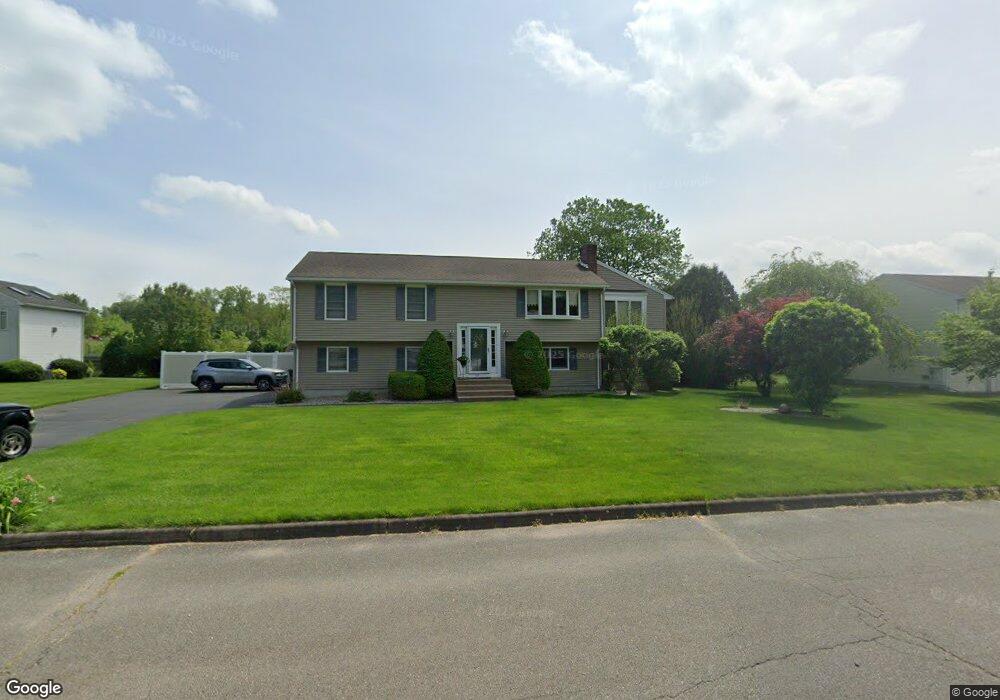
68 Cesan St Feeding Hills, MA 01030
Estimated Value: $386,000 - $508,000
4
Beds
3
Baths
1,934
Sq Ft
$226/Sq Ft
Est. Value
About This Home
This home is located at 68 Cesan St, Feeding Hills, MA 01030 and is currently estimated at $437,974, approximately $226 per square foot. 68 Cesan St is a home located in Hampden County with nearby schools including Agawam Junior High School and Agawam High School.
Ownership History
Date
Name
Owned For
Owner Type
Purchase Details
Closed on
Aug 12, 2020
Sold by
Albano Mary E and Guidetti Mariellen
Bought by
Guidetti Mariellen and Guidetti Gary A
Current Estimated Value
Home Financials for this Owner
Home Financials are based on the most recent Mortgage that was taken out on this home.
Original Mortgage
$179,900
Outstanding Balance
$127,456
Interest Rate
2.9%
Mortgage Type
New Conventional
Estimated Equity
$310,518
Purchase Details
Closed on
Sep 15, 1988
Sold by
Valley View Assocs
Bought by
Guidetti Gary A
Home Financials for this Owner
Home Financials are based on the most recent Mortgage that was taken out on this home.
Original Mortgage
$123,000
Interest Rate
10.43%
Mortgage Type
Purchase Money Mortgage
Create a Home Valuation Report for This Property
The Home Valuation Report is an in-depth analysis detailing your home's value as well as a comparison with similar homes in the area
Home Values in the Area
Average Home Value in this Area
Purchase History
| Date | Buyer | Sale Price | Title Company |
|---|---|---|---|
| Guidetti Mariellen | -- | None Available | |
| Albano Mary E | -- | None Available | |
| Guidetti Gary A | $153,750 | -- |
Source: Public Records
Mortgage History
| Date | Status | Borrower | Loan Amount |
|---|---|---|---|
| Open | Guidetti Mariellen | $179,900 | |
| Previous Owner | Guidetti Gary A | $225,000 | |
| Previous Owner | Guidetti Gary A | $50,000 | |
| Previous Owner | Guidetti Gary A | $100,000 | |
| Previous Owner | Guidetti Gary A | $123,000 |
Source: Public Records
Tax History Compared to Growth
Tax History
| Year | Tax Paid | Tax Assessment Tax Assessment Total Assessment is a certain percentage of the fair market value that is determined by local assessors to be the total taxable value of land and additions on the property. | Land | Improvement |
|---|---|---|---|---|
| 2025 | $6,117 | $417,800 | $127,700 | $290,100 |
| 2024 | $5,995 | $412,300 | $127,700 | $284,600 |
| 2023 | $5,938 | $376,300 | $115,200 | $261,100 |
| 2022 | $5,806 | $360,400 | $115,200 | $245,200 |
| 2021 | $5,258 | $313,000 | $98,300 | $214,700 |
| 2020 | $5,204 | $309,200 | $96,400 | $212,800 |
| 2019 | $4,878 | $293,000 | $93,600 | $199,400 |
| 2018 | $4,649 | $279,900 | $93,600 | $186,300 |
| 2017 | $4,296 | $263,400 | $93,600 | $169,800 |
| 2016 | $4,142 | $256,000 | $93,600 | $162,400 |
| 2015 | $4,088 | $259,700 | $93,600 | $166,100 |
Source: Public Records
Map
Nearby Homes
- 907 Shoemaker Ln
- 61-63 Orlando St
- 30 Rising St
- 36-38 Orlando St
- 309 Poplar St
- 236 S Westfield St
- 92 Highland St
- 14 Granger Dr
- 441 Silver St
- 122 Southwick St
- 157 Cambridge St
- 8 Independence Rd
- 94 Witheridge St
- 200 Anvil St
- 60 Elizabeth St
- 42 Lakeview Cir
- 10 Nolan Ln
- 712 Cooper St
- 73 Silver Lake Dr
- 92 Juniper Ridge Dr