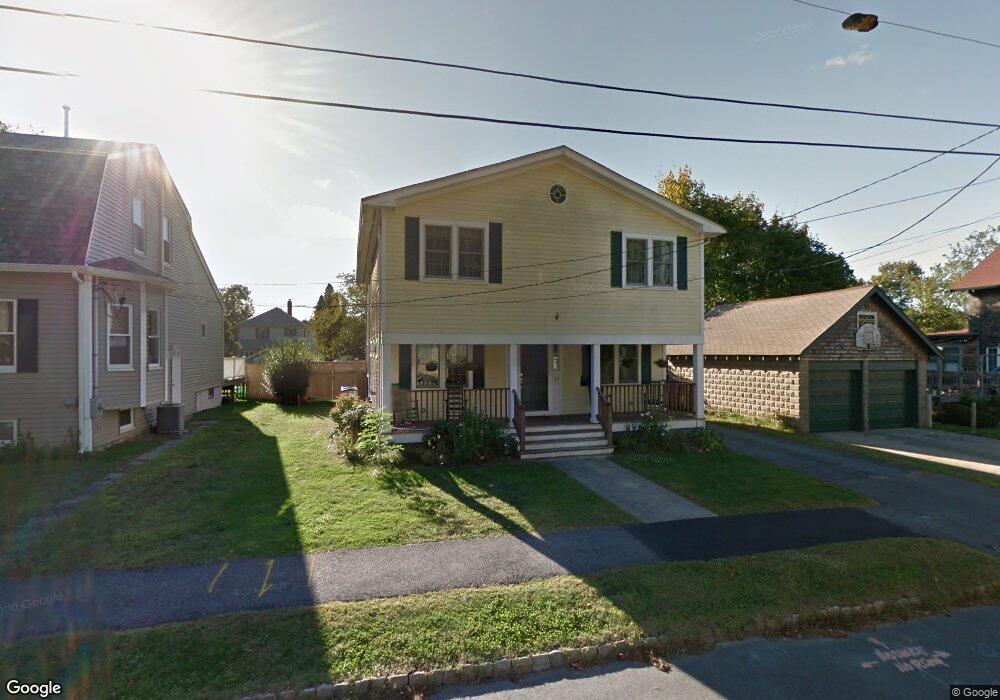
68 Chestnut St Fairhaven, MA 02719
Estimated Value: $827,000 - $866,000
5
Beds
3
Baths
2,460
Sq Ft
$347/Sq Ft
Est. Value
About This Home
This home is located at 68 Chestnut St, Fairhaven, MA 02719 and is currently estimated at $852,885, approximately $346 per square foot. 68 Chestnut St is a home located in Bristol County with nearby schools including Fairhaven High School, City On A Hill Charter Public School New Bedford, and St. Joseph School.
Ownership History
Date
Name
Owned For
Owner Type
Purchase Details
Closed on
Mar 22, 2007
Sold by
Reese Janice M and Reese Walter B
Bought by
Marron Anthony Vincent and Costa-Marron Natalie
Current Estimated Value
Purchase Details
Closed on
Sep 23, 2004
Sold by
Lawrence Anne Marie
Bought by
Reese Janice M and Reese Walter B
Create a Home Valuation Report for This Property
The Home Valuation Report is an in-depth analysis detailing your home's value as well as a comparison with similar homes in the area
Home Values in the Area
Average Home Value in this Area
Purchase History
| Date | Buyer | Sale Price | Title Company |
|---|---|---|---|
| Marron Anthony Vincent | $555,000 | -- | |
| Reese Janice M | $260,000 | -- | |
| Lawrence Anne Marie | -- | -- |
Source: Public Records
Mortgage History
| Date | Status | Borrower | Loan Amount |
|---|---|---|---|
| Previous Owner | Lawrence Anne Marie | $58,400 |
Source: Public Records
Tax History
| Year | Tax Paid | Tax Assessment Tax Assessment Total Assessment is a certain percentage of the fair market value that is determined by local assessors to be the total taxable value of land and additions on the property. | Land | Improvement |
|---|---|---|---|---|
| 2025 | $74 | $798,100 | $240,300 | $557,800 |
| 2024 | $7,152 | $774,900 | $240,300 | $534,600 |
| 2023 | $6,923 | $695,800 | $207,300 | $488,500 |
| 2022 | $6,750 | $660,500 | $188,800 | $471,700 |
| 2021 | $6,369 | $564,100 | $171,700 | $392,400 |
| 2020 | $6,239 | $564,100 | $171,700 | $392,400 |
| 2019 | $5,980 | $512,400 | $147,100 | $365,300 |
| 2018 | $5,411 | $470,400 | $140,000 | $330,400 |
| 2017 | $5,263 | $437,100 | $134,700 | $302,400 |
| 2016 | $4,999 | $410,400 | $132,000 | $278,400 |
| 2015 | $4,849 | $399,100 | $132,000 | $267,100 |
Source: Public Records
Map
Nearby Homes
- 70 Chestnut St
- 11 Lawton St
- 32 Green St
- 2 Washburn Ave
- 58 Washington St
- 32 Cedar St
- 132 Pleasant St
- 24 Middle St
- 0 Nulands Neck Unit 73286360
- 145 Pleasant St
- 54 William St
- 8 Washington St
- 39 Christian St
- 77 Adams St
- 78 Middle St
- 8 Manor Dr
- 67 Bridge St
- 181 Washington St
- 138 Main St Unit 13
- 48 Bellevue St
Your Personal Tour Guide
Ask me questions while you tour the home.