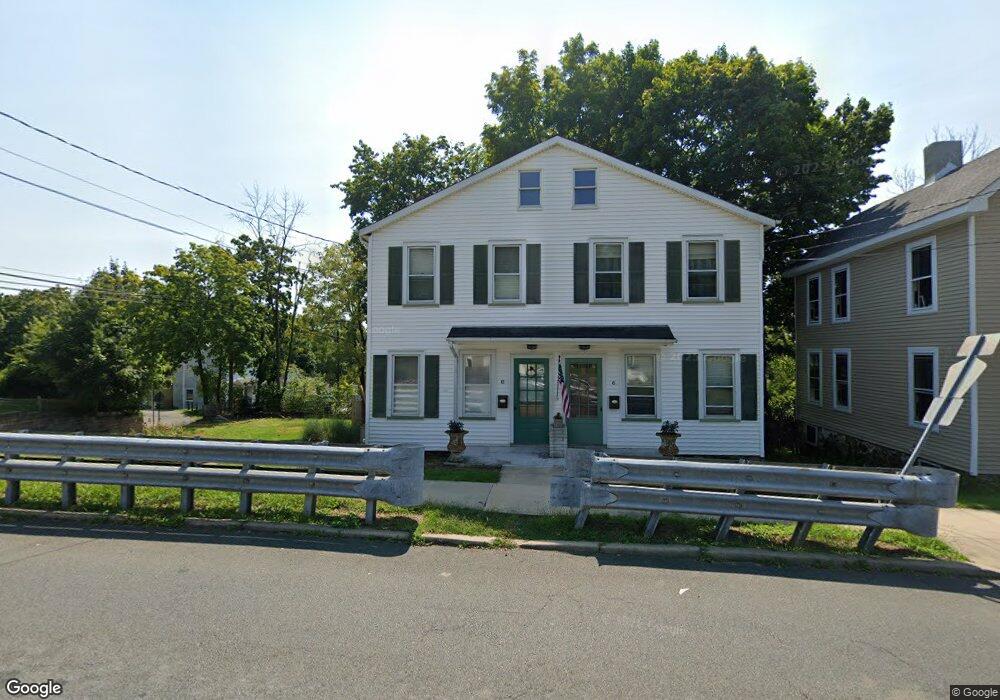
68 Church St High Bridge, NJ 08829
Estimated Value: $394,000 - $524,000
--
Bed
--
Bath
2,488
Sq Ft
$187/Sq Ft
Est. Value
About This Home
This home is located at 68 Church St, High Bridge, NJ 08829 and is currently estimated at $465,199, approximately $186 per square foot. 68 Church St is a home located in Hunterdon County with nearby schools including High Bridge Elementary School, High Bridge Middle School, and Voorhees High School.
Ownership History
Date
Name
Owned For
Owner Type
Purchase Details
Closed on
Jan 24, 2018
Sold by
Apgar Evan J and Costa Kim M
Bought by
Zavala Zambrano Oliver G
Current Estimated Value
Home Financials for this Owner
Home Financials are based on the most recent Mortgage that was taken out on this home.
Original Mortgage
$216,015
Outstanding Balance
$182,669
Interest Rate
3.93%
Mortgage Type
FHA
Estimated Equity
$282,530
Create a Home Valuation Report for This Property
The Home Valuation Report is an in-depth analysis detailing your home's value as well as a comparison with similar homes in the area
Home Values in the Area
Average Home Value in this Area
Purchase History
| Date | Buyer | Sale Price | Title Company |
|---|---|---|---|
| Zavala Zambrano Oliver G | $220,000 | Westcor Land Title Ins Co |
Source: Public Records
Mortgage History
| Date | Status | Borrower | Loan Amount |
|---|---|---|---|
| Open | Zavala Zambrano Oliver G | $216,015 |
Source: Public Records
Tax History Compared to Growth
Tax History
| Year | Tax Paid | Tax Assessment Tax Assessment Total Assessment is a certain percentage of the fair market value that is determined by local assessors to be the total taxable value of land and additions on the property. | Land | Improvement |
|---|---|---|---|---|
| 2025 | $13,069 | $356,800 | $92,800 | $264,000 |
| 2024 | $11,996 | $400,400 | $86,200 | $314,200 |
| 2023 | $11,996 | $303,400 | $70,700 | $232,700 |
| 2022 | $10,055 | $236,300 | $61,700 | $174,600 |
| 2021 | $9,716 | $235,200 | $61,700 | $173,500 |
| 2020 | $9,643 | $235,200 | $61,700 | $173,500 |
| 2019 | $9,716 | $235,200 | $61,700 | $173,500 |
| 2018 | $9,321 | $235,200 | $61,700 | $173,500 |
| 2017 | $9,184 | $238,300 | $64,800 | $173,500 |
| 2016 | $9,077 | $238,300 | $64,800 | $173,500 |
| 2015 | $8,831 | $238,300 | $64,800 | $173,500 |
| 2014 | $8,518 | $248,400 | $91,800 | $156,600 |
Source: Public Records
Map
Nearby Homes