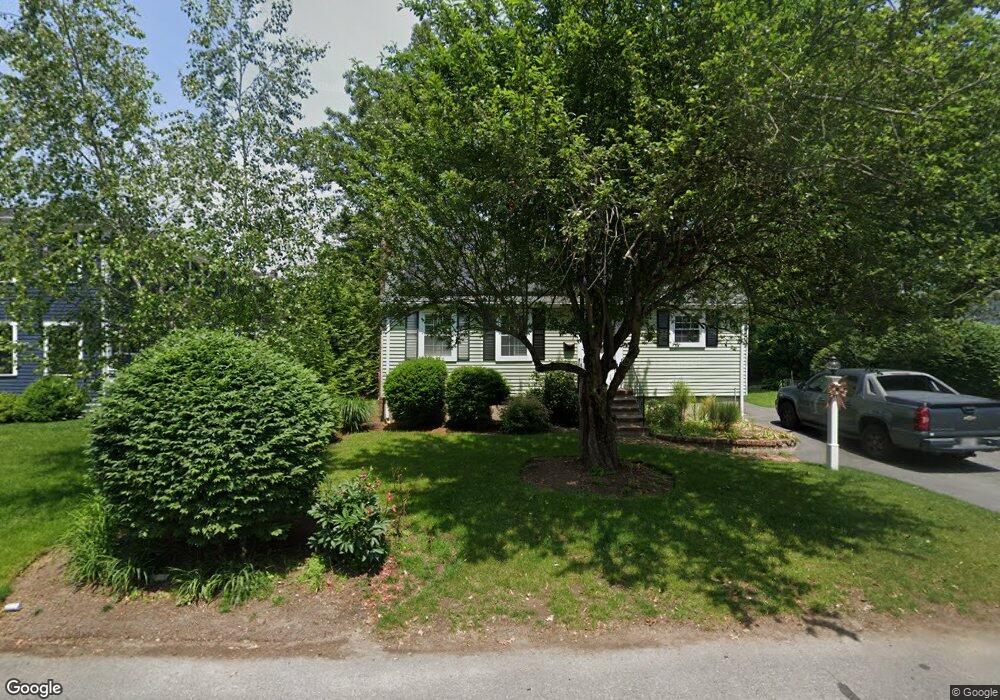
68 Colburn St Westwood, MA 02090
Estimated Value: $804,000 - $879,000
3
Beds
2
Baths
1,503
Sq Ft
$552/Sq Ft
Est. Value
About This Home
This home is located at 68 Colburn St, Westwood, MA 02090 and is currently estimated at $829,129, approximately $551 per square foot. 68 Colburn St is a home located in Norfolk County with nearby schools including Westwood High School, St Catherine Of Siena School, and Xaverian Brothers High School.
Ownership History
Date
Name
Owned For
Owner Type
Purchase Details
Closed on
Mar 30, 2018
Sold by
Ryan Joseph F Est
Bought by
Rolfe Daniel T and Rolfe Samantha M
Current Estimated Value
Home Financials for this Owner
Home Financials are based on the most recent Mortgage that was taken out on this home.
Original Mortgage
$402,480
Outstanding Balance
$345,642
Interest Rate
4.38%
Mortgage Type
New Conventional
Estimated Equity
$483,487
Purchase Details
Closed on
Jul 1, 1966
Bought by
Ryan Joseph F and Ryan Jeanne C
Create a Home Valuation Report for This Property
The Home Valuation Report is an in-depth analysis detailing your home's value as well as a comparison with similar homes in the area
Home Values in the Area
Average Home Value in this Area
Purchase History
| Date | Buyer | Sale Price | Title Company |
|---|---|---|---|
| Rolfe Daniel T | $503,100 | -- | |
| Ryan Joseph F | -- | -- |
Source: Public Records
Mortgage History
| Date | Status | Borrower | Loan Amount |
|---|---|---|---|
| Open | Rolfe Daniel T | $402,480 |
Source: Public Records
Tax History Compared to Growth
Tax History
| Year | Tax Paid | Tax Assessment Tax Assessment Total Assessment is a certain percentage of the fair market value that is determined by local assessors to be the total taxable value of land and additions on the property. | Land | Improvement |
|---|---|---|---|---|
| 2025 | $9,393 | $733,800 | $417,100 | $316,700 |
| 2024 | $8,982 | $701,200 | $397,200 | $304,000 |
| 2023 | $7,991 | $558,800 | $331,000 | $227,800 |
| 2022 | $7,718 | $520,450 | $292,650 | $227,800 |
| 2021 | $7,880 | $533,150 | $278,700 | $254,450 |
| 2020 | $7,441 | $512,850 | $278,700 | $234,150 |
| 2019 | $7,226 | $493,250 | $265,450 | $227,800 |
| 2018 | $6,852 | $454,100 | $265,450 | $188,650 |
| 2017 | $6,602 | $453,100 | $265,450 | $187,650 |
| 2016 | $6,623 | $451,750 | $265,450 | $186,300 |
| 2015 | $6,299 | $413,350 | $265,450 | $147,900 |
Source: Public Records
Map
Nearby Homes
- 39 Bayley St
- 49 Fisher St
- 132 Thatcher St
- 197 Hartford St
- 207 Hartford St
- 618 Nahatan St
- 95 Arcadia Rd
- 17 Royal Ct
- 60 Warwick Dr
- 66 Crestwood Cir
- 151 Arcadia Rd
- 4 Shoestring Ln
- 36 Kingswood Rd
- 470 Nahatan St
- 386 Winter St
- 401 Sandy Valley Rd
- 269 Vernon St
- 227 Prospect St
- 43 Oriole Rd
- 140 Burgess Ave