G
Seller's Agent in 2017
Gail Petersen Bell
Compass

Estimated Value: $1,619,000 - $1,723,000
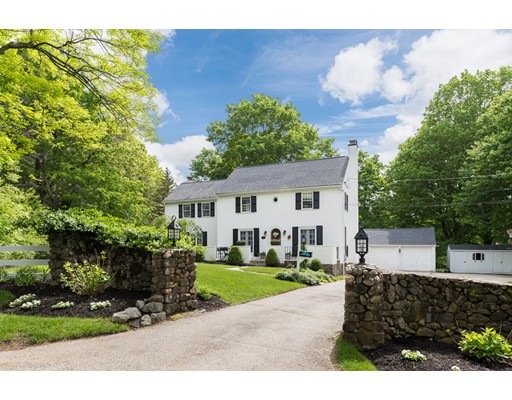
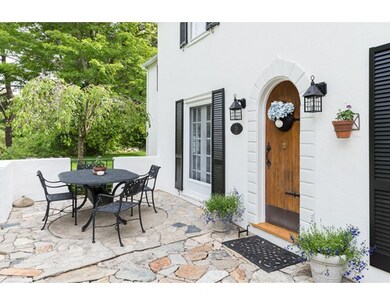
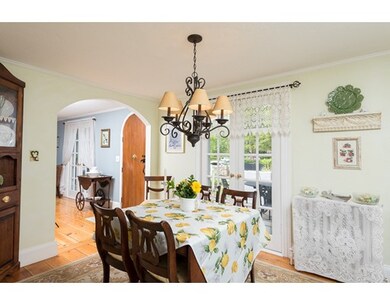
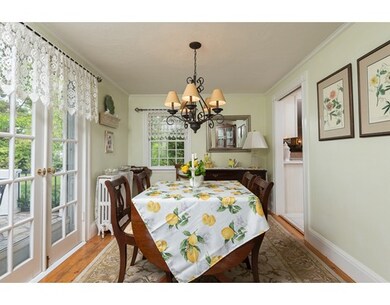
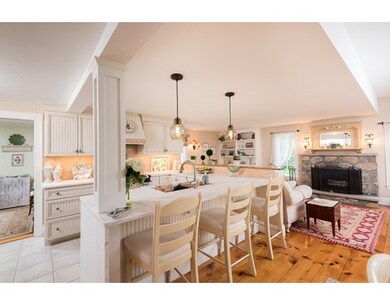
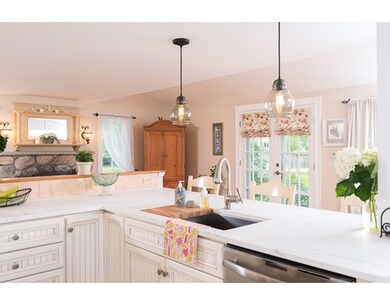
This charming and enchanting FRENCH COUNTRY COLONIAL is everyone's Favorite House! Set back from the road and sited on an incredibly beautiful corner lot with gorgeous stone walls and split rail fencing, this lovely home has it all: Wide open updated marble kitchen/family room with stone fireplace, large marble pantry, large mudroom, cozy dining room with French doors, and fireplaced living room with multiple French doors. Upstairs has a master suite with a cathedral ceiling, plenty of closet space, good-sized master bath and a small reading room/dressing room/study/nursery and two more bedrooms and the third full bath. The lower level is partially finished as a media room/game room or playroom, and the rest of the basement has great storage and a cedar closet. The yard is truly gorgeous with mature plantings and enough room for a baseball game! The Tuscan-inspired front stone patio/porch is the entryway to a truly unique and exceptional home that you will be proud to call...Home
Last Agent to Sell the Property
Gail Petersen Bell
Compass Listed on: 05/24/2017

| Date | Buyer | Sale Price | Title Company |
|---|---|---|---|
| Mciver Jonathan P | $910,000 | -- |
| Date | Status | Borrower | Loan Amount |
|---|---|---|---|
| Open | Mciver Jonathan P | $728,000 |
| Date | Event | Price | List to Sale | Price per Sq Ft |
|---|---|---|---|---|
| 09/15/2017 09/15/17 | Sold | $910,000 | +1.2% | $336 / Sq Ft |
| 05/29/2017 05/29/17 | Pending | -- | -- | -- |
| 05/24/2017 05/24/17 | For Sale | $899,000 | -- | $332 / Sq Ft |
| Year | Tax Paid | Tax Assessment Tax Assessment Total Assessment is a certain percentage of the fair market value that is determined by local assessors to be the total taxable value of land and additions on the property. | Land | Improvement |
|---|---|---|---|---|
| 2025 | $14,987 | $1,402,000 | $419,300 | $982,700 |
| 2024 | $11,658 | $1,074,500 | $419,300 | $655,200 |
| 2023 | $10,168 | $1,016,800 | $419,300 | $597,500 |
| 2022 | $9,703 | $839,400 | $361,700 | $477,700 |
| 2021 | $9,425 | $798,700 | $361,700 | $437,000 |
| 2020 | $9,209 | $798,700 | $361,700 | $437,000 |
| 2019 | $8,165 | $771,600 | $361,700 | $409,900 |
| 2018 | $8,184 | $646,600 | $361,700 | $284,900 |
| 2017 | $6,750 | $551,000 | $349,400 | $201,600 |
| 2016 | $6,673 | $534,300 | $332,700 | $201,600 |
| 2015 | $6,494 | $518,300 | $316,700 | $201,600 |
G
Seller's Agent in 2017
Gail Petersen Bell
Compass
Buyer's Agent in 2017
Maureen Doran
Coldwell Banker Realty - Hingham
(617) 680-2300
71 Total Sales
Source: MLS Property Information Network (MLS PIN)
MLS Number: 72170453
APN: HING-000107-000000-000024
Disclaimer: Certain information contained herein is derived from information provided by parties other than Homes.com. All information provided is deemed reliable, but is not guaranteed to be accurate and should be independently verified.
![]() The property listing data and information, or the Images, set forth herein were provided to MLS Property Information Network, Inc. from third party sources, including sellers, lessors and public records, and were compiled by MLS Property Information Network, Inc. The property listing data and information, and the Images, are for the personal, non-commercial use of consumers having a good faith interest in purchasing or leasing listed properties of the type displayed to them and may not be used for any purpose other than to identify prospective properties which such consumers may have a good faith interest in purchasing or leasing. MLS Property Information Network, Inc. and its subscribers disclaim any and all representations and warranties as to the accuracy of the property listing data and information, or as to the accuracy of any of the Images, set forth herein.
The property listing data and information, or the Images, set forth herein were provided to MLS Property Information Network, Inc. from third party sources, including sellers, lessors and public records, and were compiled by MLS Property Information Network, Inc. The property listing data and information, and the Images, are for the personal, non-commercial use of consumers having a good faith interest in purchasing or leasing listed properties of the type displayed to them and may not be used for any purpose other than to identify prospective properties which such consumers may have a good faith interest in purchasing or leasing. MLS Property Information Network, Inc. and its subscribers disclaim any and all representations and warranties as to the accuracy of the property listing data and information, or as to the accuracy of any of the Images, set forth herein.
Ask me questions while you tour the home.