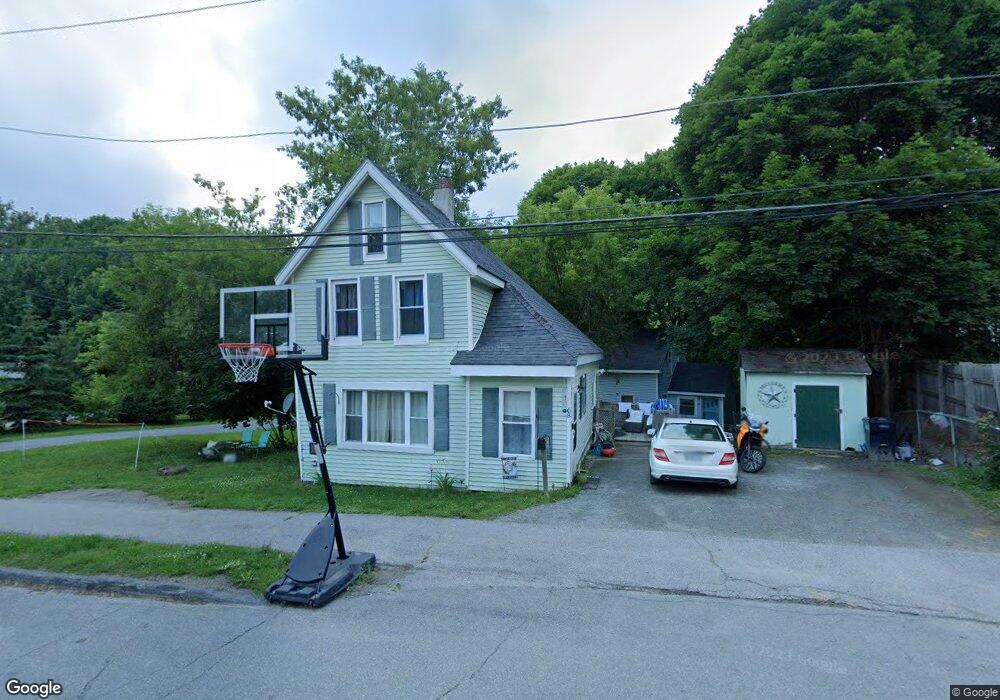
68 Curve St Bangor, ME 04401
Downtown Bangor NeighborhoodEstimated Value: $152,000 - $201,000
3
Beds
1
Bath
1,142
Sq Ft
$147/Sq Ft
Est. Value
About This Home
This home is located at 68 Curve St, Bangor, ME 04401 and is currently estimated at $167,860, approximately $146 per square foot. 68 Curve St is a home located in Penobscot County with nearby schools including Abraham Lincoln School, Mary Snow School, and William S. Cohen School.
Ownership History
Date
Name
Owned For
Owner Type
Purchase Details
Closed on
Apr 30, 2009
Sold by
Hsbc Bank Usa Tr
Bought by
Legere Toni A
Current Estimated Value
Home Financials for this Owner
Home Financials are based on the most recent Mortgage that was taken out on this home.
Original Mortgage
$50,825
Outstanding Balance
$32,268
Interest Rate
4.86%
Mortgage Type
FHA
Estimated Equity
$121,292
Purchase Details
Closed on
Apr 16, 2009
Sold by
Savard Kirstina
Bought by
Hsbc Bank Usa Tr
Home Financials for this Owner
Home Financials are based on the most recent Mortgage that was taken out on this home.
Original Mortgage
$50,825
Outstanding Balance
$32,268
Interest Rate
4.86%
Mortgage Type
FHA
Estimated Equity
$121,292
Create a Home Valuation Report for This Property
The Home Valuation Report is an in-depth analysis detailing your home's value as well as a comparison with similar homes in the area
Home Values in the Area
Average Home Value in this Area
Purchase History
| Date | Buyer | Sale Price | Title Company |
|---|---|---|---|
| Legere Toni A | -- | -- | |
| Hsbc Bank Usa Tr | -- | -- |
Source: Public Records
Mortgage History
| Date | Status | Borrower | Loan Amount |
|---|---|---|---|
| Open | Hsbc Bank Usa Tr | $50,825 |
Source: Public Records
Tax History Compared to Growth
Tax History
| Year | Tax Paid | Tax Assessment Tax Assessment Total Assessment is a certain percentage of the fair market value that is determined by local assessors to be the total taxable value of land and additions on the property. | Land | Improvement |
|---|---|---|---|---|
| 2024 | $1,618 | $87,200 | $12,200 | $75,000 |
| 2023 | $1,526 | $79,700 | $12,200 | $67,500 |
| 2022 | $1,420 | $69,600 | $12,200 | $57,400 |
| 2021 | $1,340 | $60,100 | $11,300 | $48,800 |
| 2020 | $1,297 | $55,900 | $10,700 | $45,200 |
| 2019 | $1,247 | $54,200 | $10,700 | $43,500 |
| 2018 | $1,212 | $52,800 | $10,700 | $42,100 |
| 2017 | $3,325 | $51,700 | $10,700 | $41,000 |
| 2016 | $1,139 | $50,600 | $10,700 | $39,900 |
| 2015 | $1,087 | $49,500 | $10,700 | $38,800 |
| 2014 | $1,049 | $48,100 | $10,700 | $37,400 |
| 2013 | $1,000 | $48,100 | $10,700 | $37,400 |
Source: Public Records
Map
Nearby Homes