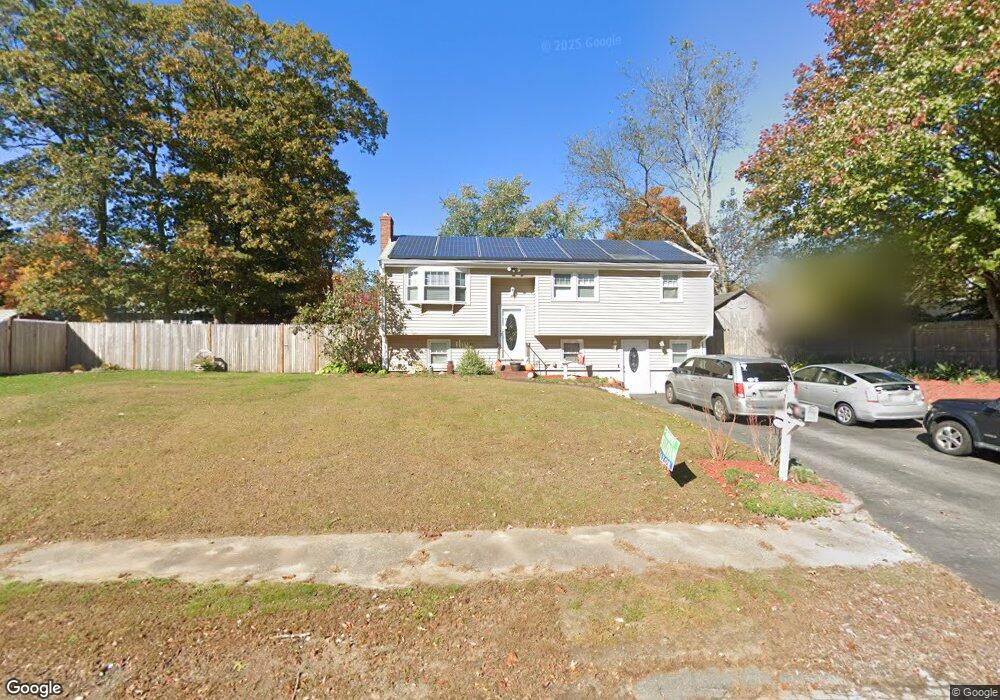
68 Delmar Rd Brockton, MA 02302
Montello NeighborhoodEstimated Value: $496,000 - $563,000
3
Beds
1
Bath
1,988
Sq Ft
$272/Sq Ft
Est. Value
About This Home
This home is located at 68 Delmar Rd, Brockton, MA 02302 and is currently estimated at $540,404, approximately $271 per square foot. 68 Delmar Rd is a home located in Plymouth County with nearby schools including Brookfield Elementary School, Downey Elementary School, and Ashfield Middle School.
Ownership History
Date
Name
Owned For
Owner Type
Purchase Details
Closed on
Apr 4, 2002
Sold by
Sinue Maybelline
Bought by
Cox Edwin D and Cox Allison M
Current Estimated Value
Purchase Details
Closed on
Dec 1, 2000
Sold by
Mathis Christopher
Bought by
Sinue Maybelline
Purchase Details
Closed on
May 28, 1999
Sold by
Leung Yuet Kwai and Leung Sang
Bought by
Mathis Christopher
Purchase Details
Closed on
Jan 16, 1993
Sold by
Tammaro William and Tammaro Patricia
Bought by
Kwai Leung Yuen
Create a Home Valuation Report for This Property
The Home Valuation Report is an in-depth analysis detailing your home's value as well as a comparison with similar homes in the area
Home Values in the Area
Average Home Value in this Area
Purchase History
| Date | Buyer | Sale Price | Title Company |
|---|---|---|---|
| Cox Edwin D | $224,900 | -- | |
| Sinue Maybelline | $156,500 | -- | |
| Mathis Christopher | $131,500 | -- | |
| Kwai Leung Yuen | $96,000 | -- |
Source: Public Records
Mortgage History
| Date | Status | Borrower | Loan Amount |
|---|---|---|---|
| Open | Kwai Leung Yuen | $30,000 | |
| Closed | Kwai Leung Yuen | $20,000 |
Source: Public Records
Tax History Compared to Growth
Tax History
| Year | Tax Paid | Tax Assessment Tax Assessment Total Assessment is a certain percentage of the fair market value that is determined by local assessors to be the total taxable value of land and additions on the property. | Land | Improvement |
|---|---|---|---|---|
| 2025 | $5,276 | $435,700 | $145,000 | $290,700 |
| 2024 | $5,122 | $426,100 | $145,000 | $281,100 |
| 2023 | $5,372 | $413,900 | $110,000 | $303,900 |
| 2022 | $4,989 | $357,100 | $100,000 | $257,100 |
| 2021 | $4,727 | $326,000 | $95,000 | $231,000 |
| 2020 | $4,919 | $324,700 | $91,000 | $233,700 |
| 2019 | $4,446 | $286,100 | $85,500 | $200,600 |
| 2018 | $4,849 | $301,900 | $85,500 | $216,400 |
| 2017 | $4,102 | $254,800 | $85,500 | $169,300 |
| 2016 | $3,911 | $225,300 | $81,500 | $143,800 |
| 2015 | $3,710 | $204,400 | $81,500 | $122,900 |
| 2014 | $3,581 | $197,500 | $81,500 | $116,000 |
Source: Public Records
Map
Nearby Homes