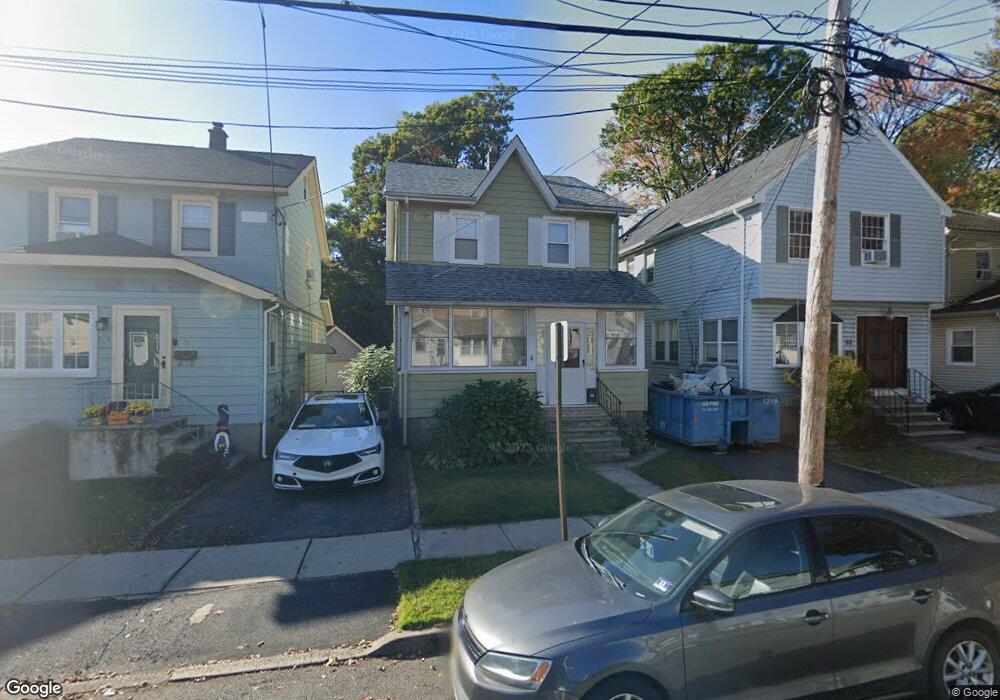
68 E Almira St Bloomfield, NJ 07003
Estimated Value: $463,606 - $542,000
--
Bed
--
Bath
1,240
Sq Ft
$409/Sq Ft
Est. Value
About This Home
This home is located at 68 E Almira St, Bloomfield, NJ 07003 and is currently estimated at $506,652, approximately $408 per square foot. 68 E Almira St is a home located in Essex County with nearby schools including Franklin School, Bloomfield Middle School, and Bloomfield High School.
Ownership History
Date
Name
Owned For
Owner Type
Purchase Details
Closed on
Sep 11, 2012
Sold by
Nicolas Marie
Bought by
Nicolas Saunid
Current Estimated Value
Purchase Details
Closed on
Jun 30, 1997
Sold by
Gunderson Marion
Bought by
Nicolas Marie and Nicolas Dieu
Home Financials for this Owner
Home Financials are based on the most recent Mortgage that was taken out on this home.
Original Mortgage
$75,000
Outstanding Balance
$11,092
Interest Rate
7.86%
Estimated Equity
$495,560
Purchase Details
Closed on
May 17, 1993
Sold by
Gunderson Marion E
Bought by
Gunderson Maron E
Create a Home Valuation Report for This Property
The Home Valuation Report is an in-depth analysis detailing your home's value as well as a comparison with similar homes in the area
Home Values in the Area
Average Home Value in this Area
Purchase History
| Date | Buyer | Sale Price | Title Company |
|---|---|---|---|
| Nicolas Saunid | -- | First American Title Ins Co | |
| Nicolas Marie | $105,000 | -- | |
| Gunderson Maron E | $100 | -- |
Source: Public Records
Mortgage History
| Date | Status | Borrower | Loan Amount |
|---|---|---|---|
| Open | Nicolas Marie | $75,000 |
Source: Public Records
Tax History Compared to Growth
Tax History
| Year | Tax Paid | Tax Assessment Tax Assessment Total Assessment is a certain percentage of the fair market value that is determined by local assessors to be the total taxable value of land and additions on the property. | Land | Improvement |
|---|---|---|---|---|
| 2025 | $9,846 | $301,300 | $110,700 | $190,600 |
| 2024 | $9,846 | $301,300 | $110,700 | $190,600 |
| 2022 | $9,648 | $301,300 | $110,700 | $190,600 |
| 2021 | $9,470 | $301,300 | $110,700 | $190,600 |
| 2020 | $9,325 | $301,300 | $110,700 | $190,600 |
| 2019 | $9,491 | $238,400 | $114,300 | $124,100 |
| 2018 | $9,450 | $238,400 | $114,300 | $124,100 |
| 2017 | $9,307 | $238,400 | $114,300 | $124,100 |
| 2016 | $9,202 | $238,400 | $114,300 | $124,100 |
| 2015 | $9,119 | $238,400 | $114,300 | $124,100 |
| 2014 | $8,952 | $238,400 | $114,300 | $124,100 |
Source: Public Records
Map
Nearby Homes
- 31 Spring St
- 28 Forest Dr
- 39 Forest Dr
- 10 Almira St Unit 14
- 10 14almira St
- 36 Clarendon Place
- 152 Belleville Ave Unit 1
- 50 James St Unit 3
- 33 Oak St
- 7 Hazelwood Rd
- 27 Gillespie Rd
- 186 Walnut St Unit 114
- 80 Belleville Ave
- 124-126 Spruce St
- 124 Spruce St Unit 126
- 366 Hoover Ave Unit 119
- 328 Hoover Ave
- 328-330 Hoover Ave
- 322 Hoover Ave Unit 73
- 298 Hoover Ave Unit 28