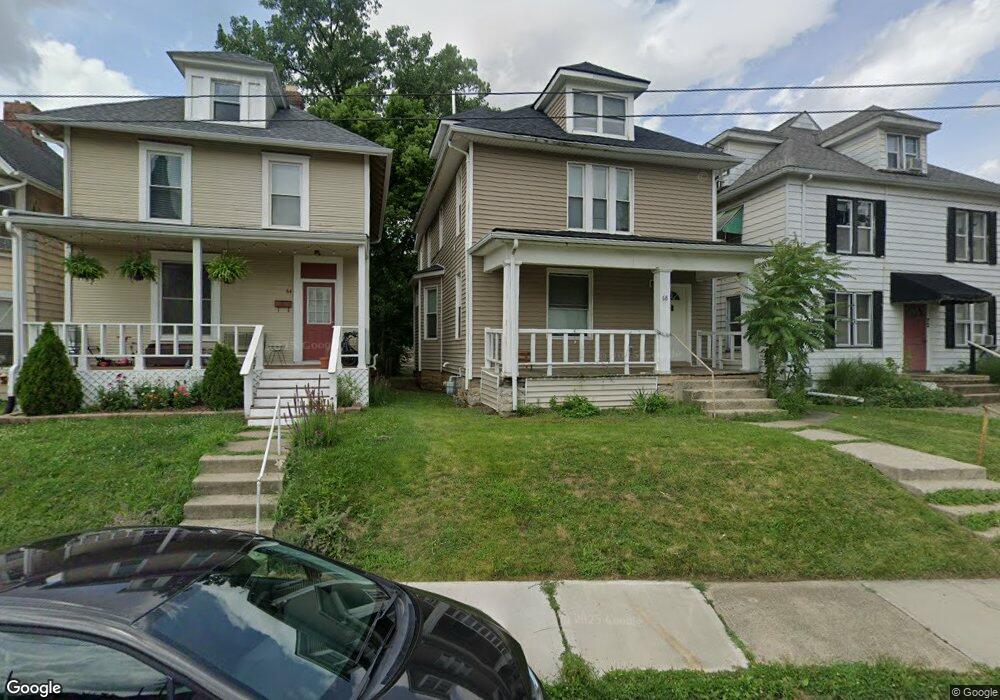
68 E Blake Ave Unit 2 Columbus, OH 43202
Old North Columbus NeighborhoodEstimated Value: $367,000 - $412,896
--
Bed
2
Baths
2,073
Sq Ft
$187/Sq Ft
Est. Value
About This Home
This home is located at 68 E Blake Ave Unit 2, Columbus, OH 43202 and is currently estimated at $388,224, approximately $187 per square foot. 68 E Blake Ave Unit 2 is a home located in Franklin County with nearby schools including Hubbard Elementary School, Dominion Middle School, and Whetstone High School.
Ownership History
Date
Name
Owned For
Owner Type
Purchase Details
Closed on
Feb 14, 2023
Sold by
Yu Anping and Yu Zhengyu
Bought by
Luckyblake Llc
Current Estimated Value
Purchase Details
Closed on
Sep 1, 2021
Sold by
Rocmax Holdings Llc
Bought by
Yu Anping and Liu Zhengyu
Purchase Details
Closed on
Jan 31, 2014
Sold by
Lapezynski Davina Jean and Lapezynski David J
Bought by
Rocmax Holdings Llc
Purchase Details
Closed on
Aug 7, 2000
Sold by
C & C Partnership
Bought by
Lapczynski David J
Home Financials for this Owner
Home Financials are based on the most recent Mortgage that was taken out on this home.
Original Mortgage
$67,500
Interest Rate
8.19%
Purchase Details
Closed on
Jan 24, 1994
Bought by
C&C Partnership
Purchase Details
Closed on
Dec 28, 1993
Purchase Details
Closed on
Jun 1, 1987
Create a Home Valuation Report for This Property
The Home Valuation Report is an in-depth analysis detailing your home's value as well as a comparison with similar homes in the area
Home Values in the Area
Average Home Value in this Area
Purchase History
| Date | Buyer | Sale Price | Title Company |
|---|---|---|---|
| Luckyblake Llc | -- | -- | |
| Yu Anping | $300,000 | Stewart Title | |
| Rocmax Holdings Llc | $110,000 | Amerititle Box | |
| Lapczynski David J | $75,000 | -- | |
| C&C Partnership | $50,000 | -- | |
| -- | $46,500 | -- | |
| -- | $600,000 | -- |
Source: Public Records
Mortgage History
| Date | Status | Borrower | Loan Amount |
|---|---|---|---|
| Previous Owner | Lapczynski David J | $67,500 |
Source: Public Records
Tax History
| Year | Tax Paid | Tax Assessment Tax Assessment Total Assessment is a certain percentage of the fair market value that is determined by local assessors to be the total taxable value of land and additions on the property. | Land | Improvement |
|---|---|---|---|---|
| 2025 | $6,750 | $147,280 | $27,720 | $119,560 |
| 2024 | $6,750 | $147,280 | $27,720 | $119,560 |
| 2023 | $6,665 | $147,280 | $27,720 | $119,560 |
| 2022 | $3,951 | $74,340 | $16,590 | $57,750 |
| 2021 | $3,958 | $74,340 | $16,590 | $57,750 |
| 2020 | $3,964 | $74,340 | $16,590 | $57,750 |
| 2019 | $3,700 | $59,500 | $13,300 | $46,200 |
| 2018 | $1,847 | $59,500 | $13,300 | $46,200 |
| 2017 | $3,917 | $63,000 | $13,300 | $49,700 |
| 2016 | $3,686 | $54,260 | $8,300 | $45,960 |
| 2015 | $2,165 | $70,010 | $8,300 | $61,710 |
| 2014 | $3,655 | $58,950 | $8,300 | $50,650 |
| 2013 | $1,638 | $53,550 | $7,525 | $46,025 |
Source: Public Records
Map
Nearby Homes
- 6 E Blake Ave
- 2540 Neil Ave
- 2394 Neil Ave
- 102 W Tompkins St
- 2458- 2458 1 2 Deming Ave
- 109 E Arcadia Ave
- 9 E Norwich Ave Unit 15
- 2362 Indiana Ave
- 2683 Neil Ave Unit 685
- 2395 Summit St Unit 397
- 363 E Hudson St Unit 365
- 2680 Deming Ave
- 53 Olentangy St
- 415 Glen Echo Cir
- 2295 N 4th St
- 2210-2212 N 4th St
- 497 E Oakland Ave
- 2082 N 4th St
- 2836-2838 Indianola Ave Unit 2836
- 61 Tibet Rd
- 68 E Blake Ave
- 64 E Blake Ave
- 72 E Blake Ave Unit 10
- 72 E Blake Ave
- 58 E Blake Ave Unit 60
- 58-60 E Blake Ave
- 76 E Blake Ave
- 80 E Blake Ave
- 2460 East Ave
- 84 E Blake Ave
- 2466 East Ave
- 84 Clinton St
- 90 E Blake Ave
- 73 W Blake Ave Unit 75
- 73 W Blake Ave
- 2470 East Ave
- 94 E Blake Ave
- 55 E Blake Ave
- 79 W Blake Ave Unit 81
- 2449 Findley Ave
Your Personal Tour Guide
Ask me questions while you tour the home.