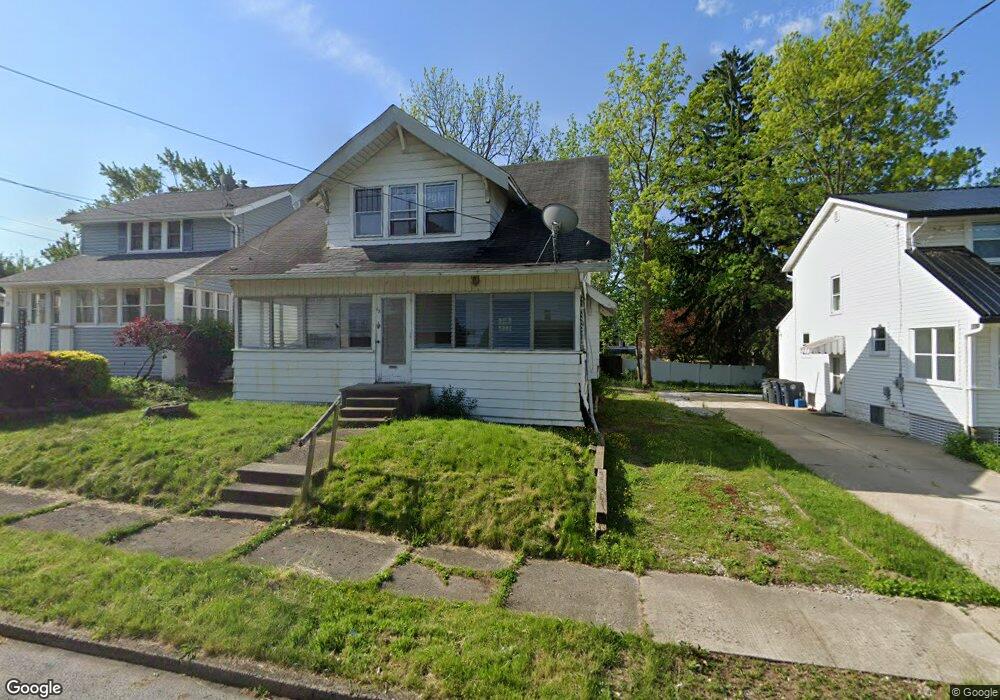
68 E Dartmore Ave Akron, OH 44301
Firestone Park NeighborhoodEstimated Value: $110,000 - $165,000
4
Beds
2
Baths
1,132
Sq Ft
$127/Sq Ft
Est. Value
About This Home
This home is located at 68 E Dartmore Ave, Akron, OH 44301 and is currently estimated at $143,546, approximately $126 per square foot. 68 E Dartmore Ave is a home located in Summit County with nearby schools including Kenmore Garfield Community Learning Center, Main Preparatory Academy, and Eagle Elementary.
Ownership History
Date
Name
Owned For
Owner Type
Purchase Details
Closed on
Nov 15, 2024
Sold by
Radhakrishnan Vijay and Radhakrishan Vijay
Bought by
68 E Dartmore Trust and Jayagopal
Current Estimated Value
Home Financials for this Owner
Home Financials are based on the most recent Mortgage that was taken out on this home.
Original Mortgage
$112,500
Interest Rate
6.35%
Mortgage Type
New Conventional
Purchase Details
Closed on
Oct 16, 2024
Sold by
Ks Yoak Enterprises Llc
Bought by
Radhakrishan Vijay
Home Financials for this Owner
Home Financials are based on the most recent Mortgage that was taken out on this home.
Original Mortgage
$112,500
Interest Rate
6.35%
Mortgage Type
New Conventional
Purchase Details
Closed on
Jul 15, 2024
Sold by
Heijnen Jeroen A and Heijnen Raquel
Bought by
Ks Yoak Enterprises Llc
Home Financials for this Owner
Home Financials are based on the most recent Mortgage that was taken out on this home.
Original Mortgage
$92,400
Interest Rate
7.03%
Mortgage Type
Construction
Create a Home Valuation Report for This Property
The Home Valuation Report is an in-depth analysis detailing your home's value as well as a comparison with similar homes in the area
Home Values in the Area
Average Home Value in this Area
Purchase History
| Date | Buyer | Sale Price | Title Company |
|---|---|---|---|
| 68 E Dartmore Trust | -- | None Listed On Document | |
| 68 E Dartmore Trust | -- | None Listed On Document | |
| Radhakrishan Vijay | $150,000 | None Listed On Document | |
| Ks Yoak Enterprises Llc | $50,000 | Chicago Title |
Source: Public Records
Mortgage History
| Date | Status | Borrower | Loan Amount |
|---|---|---|---|
| Previous Owner | Radhakrishan Vijay | $112,500 | |
| Previous Owner | Ks Yoak Enterprises Llc | $92,400 |
Source: Public Records
Tax History
| Year | Tax Paid | Tax Assessment Tax Assessment Total Assessment is a certain percentage of the fair market value that is determined by local assessors to be the total taxable value of land and additions on the property. | Land | Improvement |
|---|---|---|---|---|
| 2025 | $1,985 | $36,229 | $8,887 | $27,342 |
| 2024 | $1,985 | $36,229 | $8,887 | $27,342 |
| 2023 | $1,985 | $36,229 | $8,887 | $27,342 |
| 2022 | $1,836 | $26,254 | $6,440 | $19,814 |
| 2021 | $1,838 | $26,254 | $6,440 | $19,814 |
| 2020 | $1,811 | $26,250 | $6,440 | $19,810 |
| 2019 | $1,863 | $21,260 | $6,440 | $14,820 |
| 2018 | $1,603 | $21,260 | $6,440 | $14,820 |
| 2017 | $1,628 | $21,260 | $6,440 | $14,820 |
| 2016 | $1,629 | $21,260 | $6,440 | $14,820 |
| 2015 | $1,628 | $21,260 | $6,440 | $14,820 |
| 2014 | $1,615 | $21,260 | $6,440 | $14,820 |
| 2013 | $1,737 | $22,500 | $6,440 | $16,060 |
Source: Public Records
Map
Nearby Homes
- 29 E Dartmore Ave
- 14 E Dartmore Ave
- 30 Youtz Ave
- 127 Palmetto Ave
- 22 Youtz Ave
- 36 W Wilbeth Rd
- 154 Crescent Dr
- 76 Clinton Ave
- 75 W Dartmore Ave
- 178 Mission Dr
- 106 Selden Ave
- 244 E Catawba Ave
- 248 E Catawba Ave
- 102 E Brookside Ave
- 231 E Dresden Ave
- 62 E Ido Ave
- 1429 Bellows St
- 1835 Thornapple Ave
- 367 Wayne Ave
- 154 E Archwood Ave
- 64 E Dartmore Ave
- 60 E Dartmore Ave
- 80 E Dartmore Ave
- 67 E Dartmore Ave
- 67 E Rosewood Ave
- 56 E Dartmore Ave
- 71 E Rosewood Ave
- 75 E Rosewood Ave
- 84 E Dartmore Ave
- 63 E Dartmore Ave
- 81 E Rosewood Ave
- 75 E Dartmore Ave
- 55 E Rosewood Ave
- 55 E Rosewood Ave
- 59 E Dartmore Ave
- 1790 Dallas Ave
- 81 E Dartmore Ave
- 85 E Rosewood Ave
- 55 E Dartmore Ave
- 1782 Dallas Ave
Your Personal Tour Guide
Ask me questions while you tour the home.