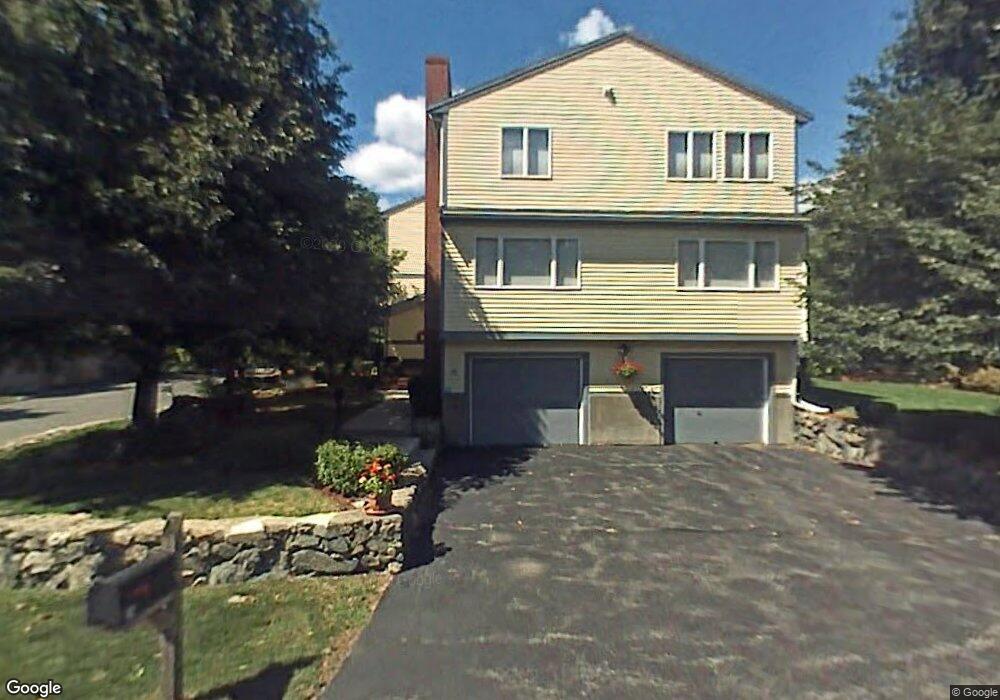
68 Edward Dr Winchester, MA 01890
West Side NeighborhoodEstimated Value: $888,017 - $926,000
2
Beds
3
Baths
1,736
Sq Ft
$525/Sq Ft
Est. Value
About This Home
This home is located at 68 Edward Dr, Winchester, MA 01890 and is currently estimated at $911,504, approximately $525 per square foot. 68 Edward Dr is a home located in Middlesex County with nearby schools including Vinson-Owen Elementary School, McCall Middle School, and Winchester High School.
Ownership History
Date
Name
Owned For
Owner Type
Purchase Details
Closed on
Oct 1, 1997
Sold by
Bluestein Evelyn R
Bought by
Walsh Rita R
Current Estimated Value
Home Financials for this Owner
Home Financials are based on the most recent Mortgage that was taken out on this home.
Original Mortgage
$192,000
Interest Rate
7.41%
Mortgage Type
Purchase Money Mortgage
Purchase Details
Closed on
Dec 7, 1995
Sold by
Bear Hill Dev T and Franchi Pasquale
Bought by
Nasson Harriet I
Create a Home Valuation Report for This Property
The Home Valuation Report is an in-depth analysis detailing your home's value as well as a comparison with similar homes in the area
Home Values in the Area
Average Home Value in this Area
Purchase History
| Date | Buyer | Sale Price | Title Company |
|---|---|---|---|
| Walsh Rita R | $256,000 | -- | |
| Nasson Harriet I | $235,000 | -- |
Source: Public Records
Mortgage History
| Date | Status | Borrower | Loan Amount |
|---|---|---|---|
| Open | Nasson Harriet I | $100,000 | |
| Open | Nasson Harriet I | $180,000 | |
| Closed | Nasson Harriet I | $192,000 |
Source: Public Records
Tax History Compared to Growth
Tax History
| Year | Tax Paid | Tax Assessment Tax Assessment Total Assessment is a certain percentage of the fair market value that is determined by local assessors to be the total taxable value of land and additions on the property. | Land | Improvement |
|---|---|---|---|---|
| 2025 | $85 | $765,100 | $0 | $765,100 |
| 2024 | $7,820 | $690,200 | $0 | $690,200 |
| 2023 | $7,845 | $664,800 | $0 | $664,800 |
| 2022 | $7,427 | $593,700 | $0 | $593,700 |
| 2021 | $7,755 | $604,900 | $0 | $604,900 |
| 2020 | $7,154 | $577,400 | $0 | $577,400 |
| 2019 | $5,993 | $494,900 | $0 | $494,900 |
| 2018 | $6,240 | $511,900 | $0 | $511,900 |
| 2017 | $7,136 | $581,100 | $0 | $581,100 |
| 2016 | $5,776 | $494,500 | $0 | $494,500 |
| 2015 | $5,280 | $434,900 | $0 | $434,900 |
| 2014 | $5,369 | $424,100 | $0 | $424,100 |
Source: Public Records
Map
Nearby Homes