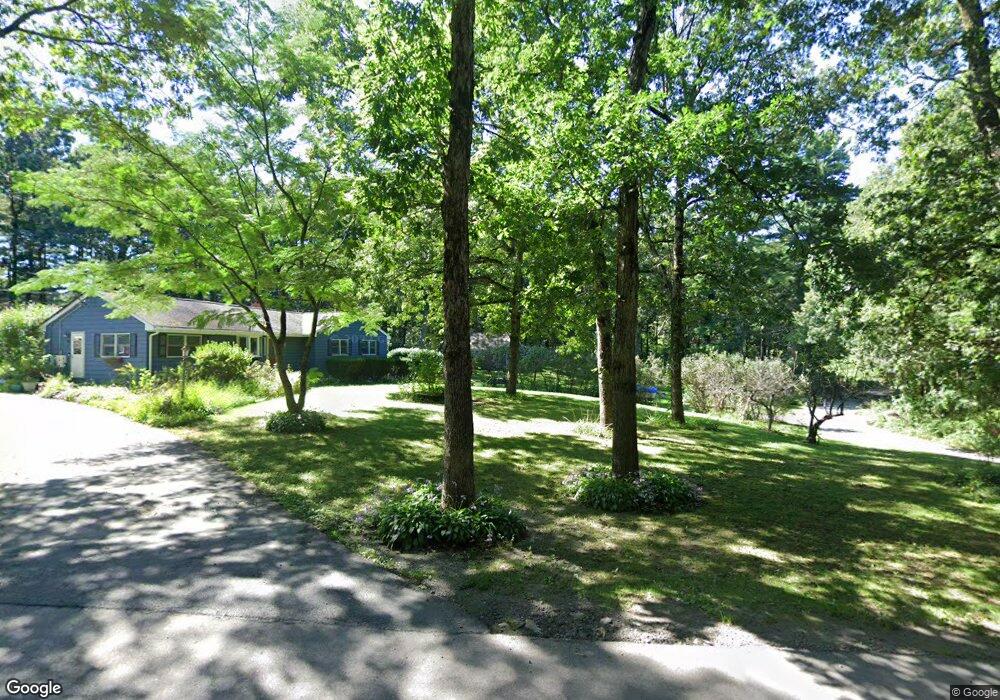
68 Elysium St Wrentham, MA 02093
Estimated Value: $586,000 - $781,000
5
Beds
2
Baths
2,500
Sq Ft
$272/Sq Ft
Est. Value
About This Home
This home is located at 68 Elysium St, Wrentham, MA 02093 and is currently estimated at $678,969, approximately $271 per square foot. 68 Elysium St is a home located in Norfolk County with nearby schools including Delaney Elementary School and Charles E Roderick.
Ownership History
Date
Name
Owned For
Owner Type
Purchase Details
Closed on
Jul 31, 1996
Sold by
Hobbs Richard C
Bought by
Bigelow Brian A and Bigelow Tracey J
Current Estimated Value
Home Financials for this Owner
Home Financials are based on the most recent Mortgage that was taken out on this home.
Original Mortgage
$125,305
Interest Rate
8.27%
Mortgage Type
Purchase Money Mortgage
Purchase Details
Closed on
Mar 15, 1991
Sold by
Wisniewski Sandra J
Bought by
Hobbs Richard C
Home Financials for this Owner
Home Financials are based on the most recent Mortgage that was taken out on this home.
Original Mortgage
$77,200
Interest Rate
9.46%
Mortgage Type
Purchase Money Mortgage
Create a Home Valuation Report for This Property
The Home Valuation Report is an in-depth analysis detailing your home's value as well as a comparison with similar homes in the area
Purchase History
| Date | Buyer | Sale Price | Title Company |
|---|---|---|---|
| Bigelow Brian A | $131,900 | -- | |
| Hobbs Richard C | $103,000 | -- |
Source: Public Records
Mortgage History
| Date | Status | Borrower | Loan Amount |
|---|---|---|---|
| Open | Hobbs Richard C | $156,000 | |
| Closed | Hobbs Richard C | $125,305 | |
| Previous Owner | Hobbs Richard C | $77,200 |
Source: Public Records
Tax History
| Year | Tax Paid | Tax Assessment Tax Assessment Total Assessment is a certain percentage of the fair market value that is determined by local assessors to be the total taxable value of land and additions on the property. | Land | Improvement |
|---|---|---|---|---|
| 2025 | $6,962 | $600,700 | $320,200 | $280,500 |
| 2024 | $6,631 | $552,600 | $320,200 | $232,400 |
| 2023 | $6,378 | $505,400 | $290,700 | $214,700 |
| 2022 | $5,945 | $434,900 | $230,900 | $204,000 |
| 2021 | $5,490 | $390,200 | $195,600 | $194,600 |
| 2020 | $5,093 | $357,400 | $161,800 | $195,600 |
| 2019 | $5,001 | $354,200 | $161,800 | $192,400 |
| 2018 | $4,642 | $326,000 | $161,400 | $164,600 |
| 2017 | $4,363 | $306,200 | $158,200 | $148,000 |
| 2016 | $4,295 | $300,800 | $153,700 | $147,100 |
| 2015 | $4,218 | $281,600 | $147,700 | $133,900 |
| 2014 | $4,152 | $271,200 | $142,100 | $129,100 |
Source: Public Records
Map
Nearby Homes
- 500 Franklin St
- 75 Jordan Rd
- 3 Oak View Terrace Unit 3
- 50 Reed Fulton Ave Unit Lot 61
- 287 Park St
- 2 Earle Stewart Ln
- 12 Earle Stewart Ln
- 10 Earle Stewart Ln Unit Lot 5
- 3 Earle Stewart Ln
- 0 Fall Ln
- 440 Chestnut St
- 64 Uncas Ave
- 82 Uncas Ave
- 82 Uncas Ave Unit 1
- 66 Uncas Ave
- 68 Uncas Ave
- 80 Uncas Ave
- 76 Uncas Ave
- 62 Uncas Ave
- 139 King St Unit 306
- 20 Whiting St
- 58 Elysium St
- 30 Whiting St
- 60 Elysium St
- 70 Elysium St
- 54 Elysium St
- 55 Elysium St
- 74 Elysium St
- 44 Elysium St
- 108 Elysium St
- 1 Woolford Rd
- 118 Elysium St
- 5 Woolford Rd
- 12 Woolford Rd
- 1 Elysium St Unit LOT #1
- 9 Woolford Rd
- LOT J-09 Woolford Rd
- 40 Woolford Rd
- 10 Woolford Road (Rear)
- 10 Woolford Road (Rear)
Your Personal Tour Guide
Ask me questions while you tour the home.