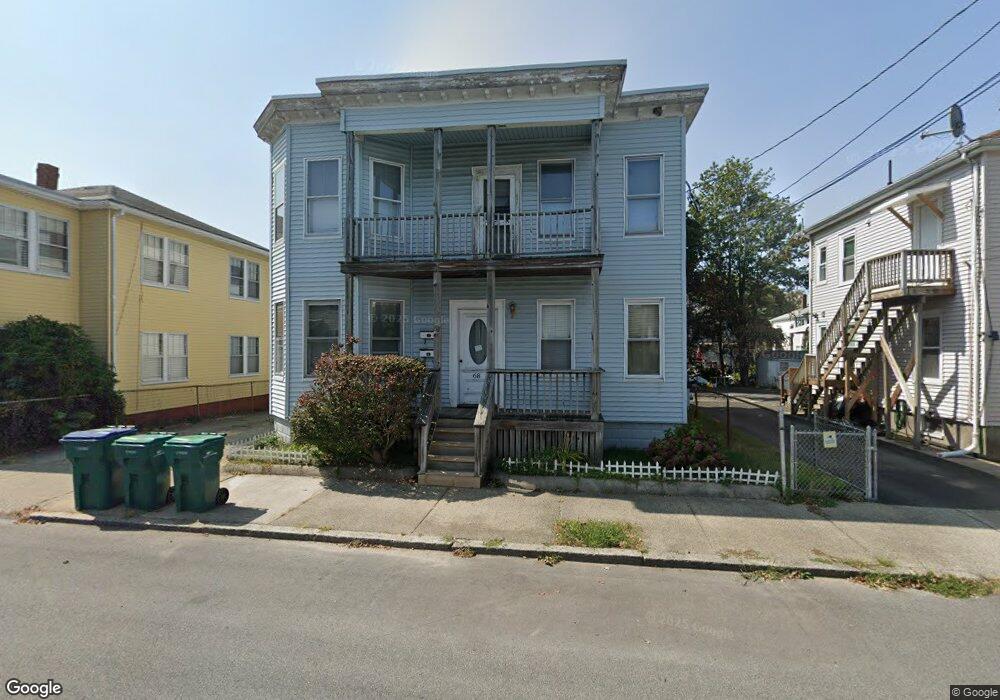
68 Flint St Lynn, MA 01905
Lower Boston Street NeighborhoodEstimated Value: $665,000 - $829,000
4
Beds
2
Baths
2,394
Sq Ft
$298/Sq Ft
Est. Value
About This Home
This home is located at 68 Flint St, Lynn, MA 01905 and is currently estimated at $713,818, approximately $298 per square foot. 68 Flint St is a home located in Essex County with nearby schools including William R. Fallon School, Lincoln-Thomson Elementary School, and Breed Middle School.
Ownership History
Date
Name
Owned For
Owner Type
Purchase Details
Closed on
Apr 30, 2013
Sold by
Silvia Barbara A
Bought by
Silvia Barbara A and Silvia Thomas
Current Estimated Value
Home Financials for this Owner
Home Financials are based on the most recent Mortgage that was taken out on this home.
Original Mortgage
$190,000
Outstanding Balance
$39,268
Interest Rate
3.64%
Mortgage Type
New Conventional
Estimated Equity
$674,550
Purchase Details
Closed on
Mar 14, 2005
Sold by
Kennedy Joan E and Libman Joan E
Bought by
Silvia Barbara A
Create a Home Valuation Report for This Property
The Home Valuation Report is an in-depth analysis detailing your home's value as well as a comparison with similar homes in the area
Home Values in the Area
Average Home Value in this Area
Purchase History
| Date | Buyer | Sale Price | Title Company |
|---|---|---|---|
| Silvia Barbara A | -- | -- | |
| Silvia Barbara A | -- | -- | |
| Silvia Barbara A | -- | -- | |
| Silvia Barbara A | -- | -- |
Source: Public Records
Mortgage History
| Date | Status | Borrower | Loan Amount |
|---|---|---|---|
| Open | Silvia Barbara A | $190,000 | |
| Closed | Silvia Barbara A | $190,000 |
Source: Public Records
Tax History
| Year | Tax Paid | Tax Assessment Tax Assessment Total Assessment is a certain percentage of the fair market value that is determined by local assessors to be the total taxable value of land and additions on the property. | Land | Improvement |
|---|---|---|---|---|
| 2025 | $6,970 | $672,782 | $226,600 | $446,182 |
| 2024 | $6,445 | $612,100 | $199,100 | $413,000 |
| 2023 | $6,575 | $589,700 | $205,600 | $384,100 |
| 2022 | $6,319 | $508,400 | $152,300 | $356,100 |
| 2021 | $5,957 | $457,200 | $140,000 | $317,200 |
| 2020 | $5,589 | $417,100 | $134,800 | $282,300 |
| 2019 | $5,438 | $380,300 | $126,900 | $253,400 |
| 2018 | $5,359 | $353,700 | $140,000 | $213,700 |
| 2017 | $4,997 | $320,300 | $116,400 | $203,900 |
| 2016 | $4,684 | $289,500 | $108,900 | $180,600 |
| 2015 | $4,502 | $268,800 | $108,100 | $160,700 |
Source: Public Records
Map
Nearby Homes
- 70 Wyman St
- 46 Wilfred St
- 50-50A Kirtland St
- 73 Waterhill St
- 590 Boston St Unit 303
- 78-80 Spencer St
- 268 Walnut St
- 20 Murray St
- 34 Grove St
- 16 Salem St
- 79 Laurel St
- 45 Cottage St Unit 3
- 32 Birch Brook Landing Unit 23
- 32 Birch Brook Landing Unit 25
- 32 Birch Brook Landing Unit 22
- 6 Morris St
- 32 Birch Brook Rd Unit 13
- 32 Birch Brook Rd Unit 27
- 32 Birch Brook Rd Unit 16
- 32 Birch Brook Rd Unit 1
Your Personal Tour Guide
Ask me questions while you tour the home.