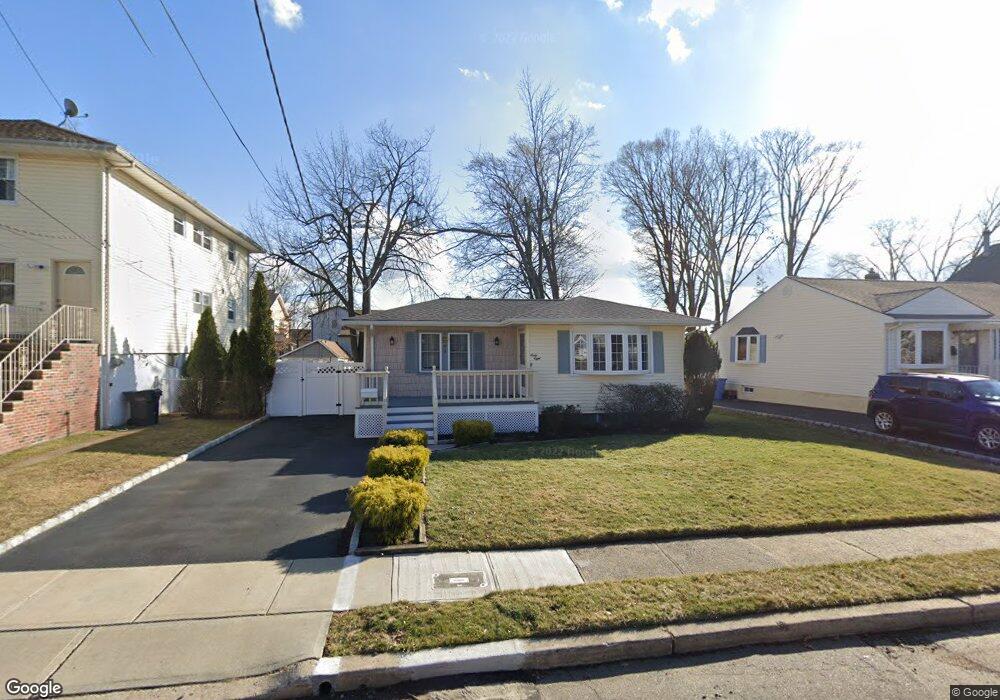
68 Forrest St Metuchen, NJ 08840
Estimated Value: $585,000 - $720,000
3
Beds
2
Baths
1,212
Sq Ft
$531/Sq Ft
Est. Value
About This Home
This home is located at 68 Forrest St, Metuchen, NJ 08840 and is currently estimated at $644,177, approximately $531 per square foot. 68 Forrest St is a home located in Middlesex County with nearby schools including Campbell Elementary School, Edgar Middle School, and Metuchen High School.
Ownership History
Date
Name
Owned For
Owner Type
Purchase Details
Closed on
Oct 15, 2015
Sold by
Sielski Matthew and Sielski Angela
Bought by
Schwartz Lan and Schwartz Ian
Current Estimated Value
Purchase Details
Closed on
Sep 22, 2009
Sold by
Cui Man Gang and Gang Cui Man
Bought by
Sielski Matthew and Sielski Angela
Home Financials for this Owner
Home Financials are based on the most recent Mortgage that was taken out on this home.
Original Mortgage
$247,500
Interest Rate
5.14%
Mortgage Type
New Conventional
Purchase Details
Closed on
Jun 18, 1999
Sold by
Zjawin Walter
Bought by
Cui Man Gang
Home Financials for this Owner
Home Financials are based on the most recent Mortgage that was taken out on this home.
Original Mortgage
$100,000
Interest Rate
8.1%
Create a Home Valuation Report for This Property
The Home Valuation Report is an in-depth analysis detailing your home's value as well as a comparison with similar homes in the area
Home Values in the Area
Average Home Value in this Area
Purchase History
| Date | Buyer | Sale Price | Title Company |
|---|---|---|---|
| Schwartz Lan | $345,000 | Trident Abstract Title Agenc | |
| Sielski Matthew | $330,000 | None Available | |
| Cui Man Gang | $157,000 | -- |
Source: Public Records
Mortgage History
| Date | Status | Borrower | Loan Amount |
|---|---|---|---|
| Previous Owner | Sielski Matthew | $247,500 | |
| Previous Owner | Cui Man Gang | $100,000 |
Source: Public Records
Tax History Compared to Growth
Tax History
| Year | Tax Paid | Tax Assessment Tax Assessment Total Assessment is a certain percentage of the fair market value that is determined by local assessors to be the total taxable value of land and additions on the property. | Land | Improvement |
|---|---|---|---|---|
| 2025 | $9,876 | $142,000 | $76,000 | $66,000 |
| 2024 | $9,545 | $142,000 | $76,000 | $66,000 |
| 2023 | $9,545 | $142,000 | $76,000 | $66,000 |
| 2022 | $9,047 | $142,000 | $76,000 | $66,000 |
| 2021 | $8,840 | $142,000 | $76,000 | $66,000 |
| 2020 | $8,723 | $142,000 | $76,000 | $66,000 |
| 2019 | $8,466 | $142,000 | $76,000 | $66,000 |
| 2018 | $8,435 | $142,000 | $76,000 | $66,000 |
| 2017 | $8,289 | $140,000 | $76,000 | $64,000 |
| 2016 | $7,963 | $138,000 | $76,000 | $62,000 |
| 2015 | $7,673 | $136,000 | $75,600 | $60,400 |
| 2014 | $7,465 | $135,700 | $75,600 | $60,100 |
Source: Public Records
Map
Nearby Homes