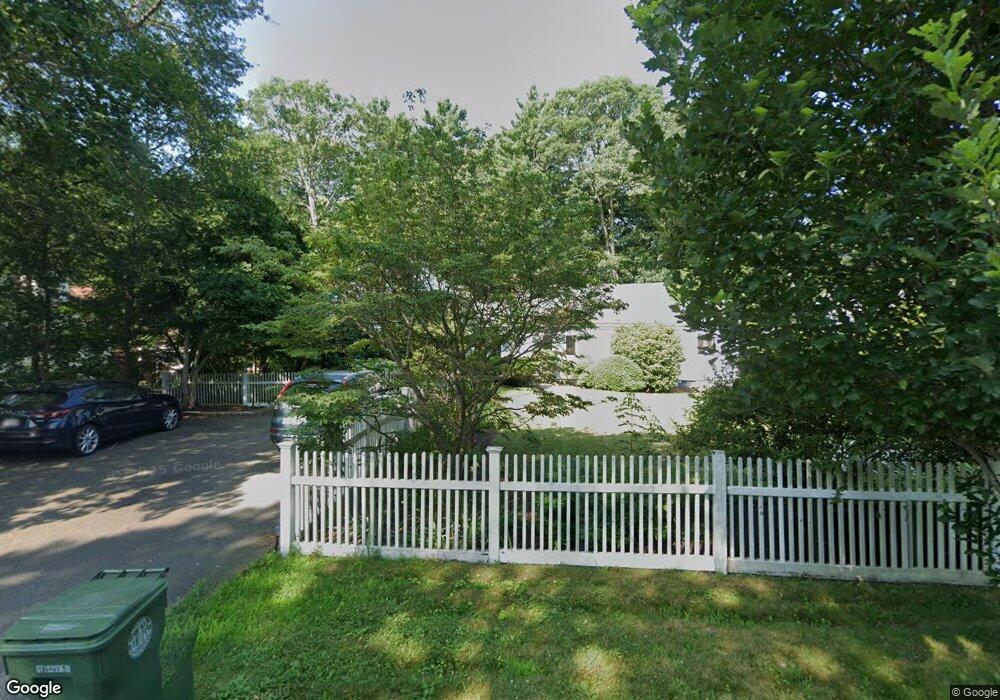
68 Front St Marion, MA 02738
Marion Center NeighborhoodEstimated Value: $1,223,000 - $1,815,000
4
Beds
3
Baths
2,626
Sq Ft
$526/Sq Ft
Est. Value
About This Home
This home is located at 68 Front St, Marion, MA 02738 and is currently estimated at $1,381,856, approximately $526 per square foot. 68 Front St is a home located in Plymouth County with nearby schools including Old Rochester Regional High School and Tabor Academy.
Ownership History
Date
Name
Owned For
Owner Type
Purchase Details
Closed on
Feb 25, 2010
Sold by
Blanchette Roger F and Blanchette Debra M
Bought by
Burke John and Burke Heather
Current Estimated Value
Purchase Details
Closed on
Sep 21, 2007
Sold by
Blanchette Debra M and Blanchette Roger F
Bought by
Blanchette Debra M and Blanchette Roger F
Purchase Details
Closed on
Jan 18, 2005
Sold by
Blanchette Debra M
Bought by
Blanchette Debra M and Blanchette Roger F
Purchase Details
Closed on
Aug 30, 1996
Sold by
Booth William H and Erwin-Booth Martha
Bought by
Blanchette Roger F and Blanchette Debra M
Create a Home Valuation Report for This Property
The Home Valuation Report is an in-depth analysis detailing your home's value as well as a comparison with similar homes in the area
Home Values in the Area
Average Home Value in this Area
Purchase History
| Date | Buyer | Sale Price | Title Company |
|---|---|---|---|
| Burke John | $619,750 | -- | |
| Blanchette Debra M | -- | -- | |
| Blanchette Debra M | -- | -- | |
| Blanchette Roger F | $317,000 | -- |
Source: Public Records
Mortgage History
| Date | Status | Borrower | Loan Amount |
|---|---|---|---|
| Open | Blanchette Roger F | $489,000 | |
| Closed | Blanchette Roger F | $495,750 |
Source: Public Records
Tax History
| Year | Tax Paid | Tax Assessment Tax Assessment Total Assessment is a certain percentage of the fair market value that is determined by local assessors to be the total taxable value of land and additions on the property. | Land | Improvement |
|---|---|---|---|---|
| 2025 | $9,378 | $1,006,200 | $497,500 | $508,700 |
| 2024 | $8,463 | $913,900 | $454,300 | $459,600 |
| 2023 | $8,166 | $865,000 | $421,800 | $443,200 |
| 2022 | $7,449 | $686,500 | $407,700 | $278,800 |
| 2021 | $7,540 | $666,100 | $374,400 | $291,700 |
| 2020 | $6,910 | $590,600 | $298,900 | $291,700 |
| 2019 | $6,072 | $550,500 | $272,200 | $278,300 |
| 2018 | $6,467 | $564,800 | $295,800 | $269,000 |
| 2017 | $6,444 | $564,800 | $295,800 | $269,000 |
| 2016 | $6,555 | $579,600 | $295,800 | $283,800 |
| 2015 | $6,348 | $571,400 | $300,900 | $270,500 |
Source: Public Records
Map
Nearby Homes
Your Personal Tour Guide
Ask me questions while you tour the home.