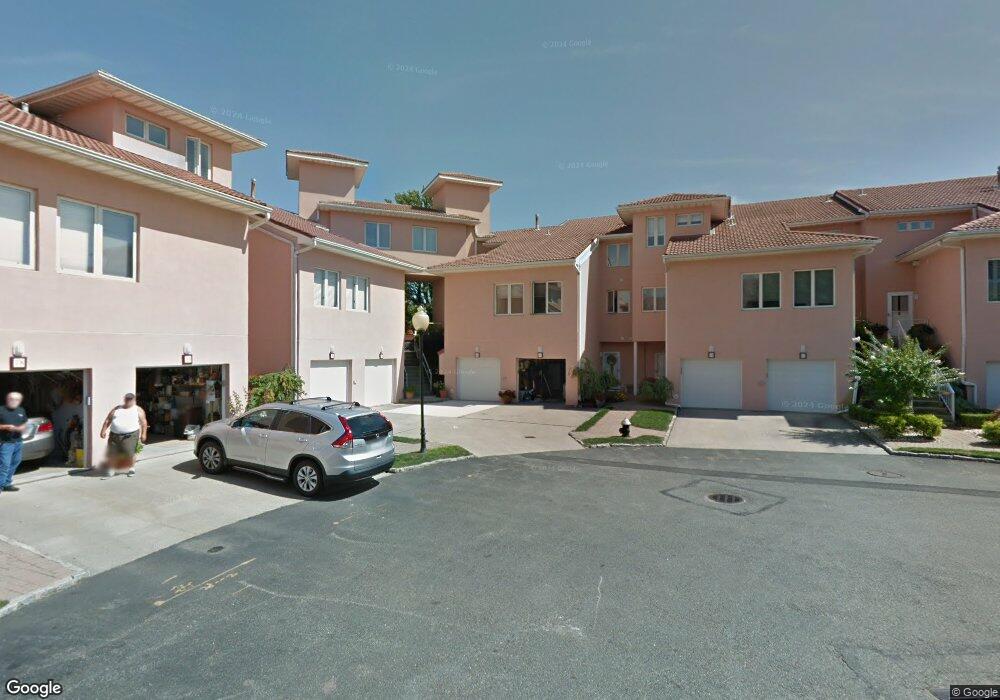
68 Harbour Ct Unit 68 Staten Island, NY 10308
Great Kills NeighborhoodEstimated Value: $618,000 - $796,000
2
Beds
3
Baths
1,769
Sq Ft
$406/Sq Ft
Est. Value
About This Home
This home is located at 68 Harbour Ct Unit 68, Staten Island, NY 10308 and is currently estimated at $718,446, approximately $406 per square foot. 68 Harbour Ct Unit 68 is a home located in Richmond County with nearby schools including P.S. 8 Shirlee Solomon, Myra S. Barnes Intermediate School 24, and New Dorp High School.
Ownership History
Date
Name
Owned For
Owner Type
Purchase Details
Closed on
Nov 27, 2012
Sold by
Gorga Frances
Bought by
Gorga Frances
Current Estimated Value
Purchase Details
Closed on
Jan 7, 2009
Sold by
Lara Leopold
Bought by
Gorga Frances
Purchase Details
Closed on
Dec 20, 2004
Sold by
Gorga Frances
Bought by
Lara Leopold
Purchase Details
Closed on
May 14, 2003
Sold by
Gulemmo Anthony
Bought by
Gorga Frances
Home Financials for this Owner
Home Financials are based on the most recent Mortgage that was taken out on this home.
Original Mortgage
$390,000
Interest Rate
6.43%
Mortgage Type
Unknown
Purchase Details
Closed on
Feb 17, 1999
Sold by
Granite Michael and Granite Theresa
Bought by
Gulemmo Anthony
Home Financials for this Owner
Home Financials are based on the most recent Mortgage that was taken out on this home.
Original Mortgage
$225,000
Interest Rate
7.04%
Create a Home Valuation Report for This Property
The Home Valuation Report is an in-depth analysis detailing your home's value as well as a comparison with similar homes in the area
Home Values in the Area
Average Home Value in this Area
Purchase History
| Date | Buyer | Sale Price | Title Company |
|---|---|---|---|
| Gorga Frances | -- | None Available | |
| Gorga Frances | -- | None Available | |
| Lara Leopold | -- | -- | |
| Gorga Frances | $590,000 | -- | |
| Gulemmo Anthony | $340,000 | -- |
Source: Public Records
Mortgage History
| Date | Status | Borrower | Loan Amount |
|---|---|---|---|
| Previous Owner | Gorga Frances | $390,000 | |
| Previous Owner | Gulemmo Anthony | $225,000 |
Source: Public Records
Tax History Compared to Growth
Tax History
| Year | Tax Paid | Tax Assessment Tax Assessment Total Assessment is a certain percentage of the fair market value that is determined by local assessors to be the total taxable value of land and additions on the property. | Land | Improvement |
|---|---|---|---|---|
| 2025 | $6,406 | $47,199 | $3,014 | $44,185 |
| 2024 | $6,406 | $38,633 | $3,474 | $35,159 |
| 2023 | $6,111 | $30,091 | $3,517 | $26,574 |
| 2022 | $5,667 | $28,388 | $4,208 | $24,180 |
| 2021 | $5,974 | $28,387 | $4,208 | $24,179 |
| 2020 | $6,224 | $30,596 | $4,208 | $26,388 |
| 2019 | $6,151 | $30,607 | $4,208 | $26,399 |
| 2018 | $5,833 | $28,614 | $4,150 | $24,464 |
| 2017 | $5,600 | $27,472 | $3,984 | $23,488 |
| 2016 | $5,181 | $25,918 | $3,684 | $22,234 |
| 2015 | $4,251 | $24,452 | $3,541 | $20,911 |
| 2014 | $4,251 | $27,345 | $3,960 | $23,385 |
Source: Public Records
Map
Nearby Homes
- 60 Harbour Ct Unit 60
- 46 Harbour Ct Unit 46
- 23 Harbour Ct Unit 23
- 77 Harbour Ct Unit 77
- 22 Harbour Ct Unit 30
- 111 Goodall St
- 224 Wiman Ave
- 198 Wiman Ave
- 72 Goodall St
- 98 Glover St
- 61 Heinz Ave
- 292 Tennyson Dr
- 4028 Hylan Blvd
- 346 Cleveland Ave
- 9 Russell St
- 11 Russell St
- 79 Robinson Ave
- 309 Cleveland Ave
- 268 Nelson Ave
- 69 Littlefield Ave
- 66 Harbour Ct Unit 66
- 64 Harbour Ct Unit 64
- 74 Harbour Ct Unit 74
- 58 Harbour Ct Unit 58
- 76 Harbour Ct Unit 76
- 56 Harbour Ct Unit 56
- 52 Harbour Ct Unit 52
- 50 Harbour Ct Unit 50
- 73 Harbour Ct Unit 73
- 46 Harbour Ct Unit 1
- 59 Harbour Ct Unit 59
- 57 Harbour Ct Unit 57
- 54 Harbour Ct Unit 54
- 62 Harbour Ct Unit 62
- 78 Harbour Ct Unit 78
- 79 Harbour Ct Unit 79
- 71 Harbour Ct Unit 71
- 65 Harbour Ct Unit 65
- 63 Harbour Ct Unit 63
- 61 Harbour Ct Unit 61