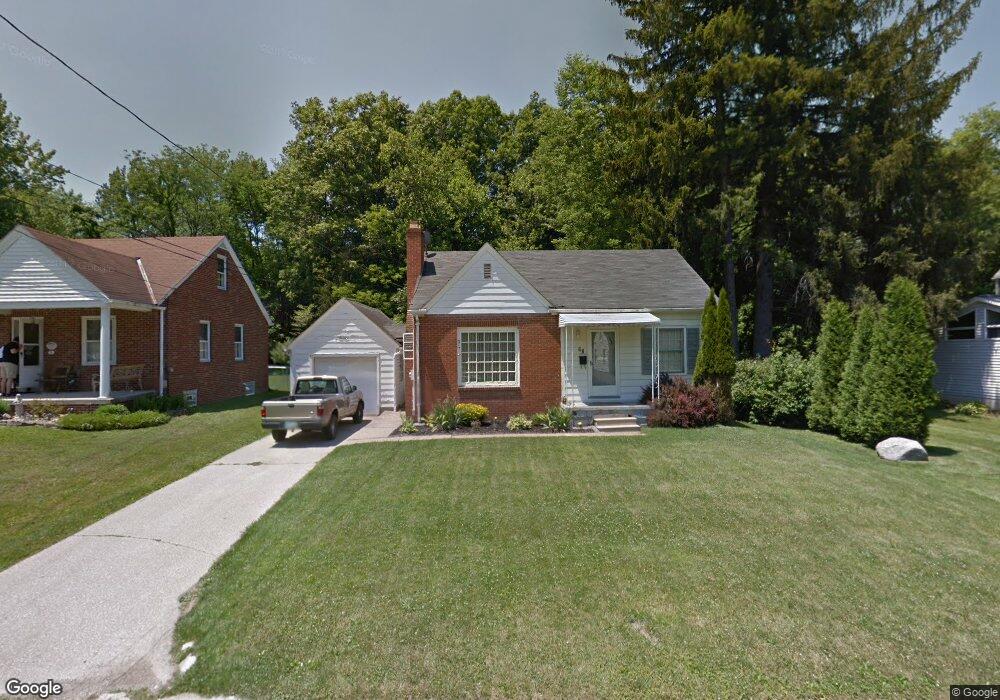
68 Harvard Ave Mansfield, OH 44906
Estimated Value: $95,482 - $136,000
3
Beds
1
Bath
1,201
Sq Ft
$95/Sq Ft
Est. Value
About This Home
This home is located at 68 Harvard Ave, Mansfield, OH 44906 and is currently estimated at $113,621, approximately $94 per square foot. 68 Harvard Ave is a home located in Richland County with nearby schools including Mansfield Elective Academy, The Richland School of Academic Arts, and Goal Digital Academy.
Ownership History
Date
Name
Owned For
Owner Type
Purchase Details
Closed on
May 6, 2014
Sold by
Degirolamo Anthony J
Bought by
Knapp Rentals Llc
Current Estimated Value
Purchase Details
Closed on
Jan 8, 2014
Sold by
Herman Trust Properties Llc
Bought by
Degirolamo Anthony J
Purchase Details
Closed on
Mar 30, 2004
Sold by
Sharrock David R and Sharrock Doris A
Bought by
Herman Trust Properties Llc
Purchase Details
Closed on
Feb 20, 2004
Sold by
Moore Spencer E and Moore Trena A
Bought by
Sharrock David R and Sharrock Doris
Purchase Details
Closed on
Jan 3, 2000
Sold by
Gardner Mary J
Bought by
Moore Spencer E and Moore Trina A
Home Financials for this Owner
Home Financials are based on the most recent Mortgage that was taken out on this home.
Original Mortgage
$40,000
Interest Rate
7.31%
Mortgage Type
New Conventional
Create a Home Valuation Report for This Property
The Home Valuation Report is an in-depth analysis detailing your home's value as well as a comparison with similar homes in the area
Home Values in the Area
Average Home Value in this Area
Purchase History
| Date | Buyer | Sale Price | Title Company |
|---|---|---|---|
| Knapp Rentals Llc | $27,500 | Chicago Title | |
| Degirolamo Anthony J | -- | Chicago Title | |
| Herman Trust Properties Llc | -- | Acs Title | |
| Sharrock David R | $102,000 | Acs Title | |
| Moore Spencer E | $50,000 | -- |
Source: Public Records
Mortgage History
| Date | Status | Borrower | Loan Amount |
|---|---|---|---|
| Previous Owner | Moore Spencer E | $40,000 |
Source: Public Records
Tax History
| Year | Tax Paid | Tax Assessment Tax Assessment Total Assessment is a certain percentage of the fair market value that is determined by local assessors to be the total taxable value of land and additions on the property. | Land | Improvement |
|---|---|---|---|---|
| 2024 | $737 | $15,400 | $3,800 | $11,600 |
| 2023 | $737 | $18,410 | $3,800 | $14,610 |
| 2022 | $707 | $12,370 | $3,260 | $9,110 |
| 2021 | $712 | $12,370 | $3,260 | $9,110 |
| 2020 | $728 | $12,370 | $3,260 | $9,110 |
| 2019 | $807 | $12,370 | $3,260 | $9,110 |
| 2018 | $796 | $12,370 | $3,260 | $9,110 |
| 2017 | $783 | $12,370 | $3,260 | $9,110 |
| 2016 | $792 | $12,260 | $3,440 | $8,820 |
| 2015 | $756 | $12,260 | $3,440 | $8,820 |
| 2014 | $1,066 | $17,510 | $3,440 | $14,070 |
| 2012 | $430 | $18,430 | $3,620 | $14,810 |
Source: Public Records
Map
Nearby Homes
- 76 Harvard Ave
- 988 Kentland Dr
- 216 S Trimble Rd Unit 218
- 232 S Trimble Rd Unit 234
- 244 S Trimble Rd Unit 246
- 143 Buckeye Ave
- 43 Eleanor Ave
- 960 W Linden Cir
- 0 W Fourth St - Trimble Lenox
- 173 Brookwood Way N
- 129 Fairlawn Ave
- 135 Fairlawn Ave
- 143 Fairlawn Ave
- 356 S Linden Rd
- 1157 Deer Run Rd
- 78 S Home Rd
- 340 Boston Ave
- 679 Coleman Rd
- 108 Stewart Ave S
- 116 Stewart Ave S
- 62 Harvard Ave
- 84 Harvard Ave
- 90 Harvard Ave
- 59 Harvard Ave
- 73 Harvard Ave
- 63 Harvard Ave
- 67 Harvard Ave
- 79 Harvard Ave
- 55 Harvard Ave
- 83 Harvard Ave
- 98 Harvard Ave
- 87 Harvard Ave
- 46 Harvard Ave
- 91 Harvard Ave
- 1097 Tudor St
- 102 Harvard Ave
- 93 Harvard Ave
- 40 Harvard Ave
- 1106 Tudor St
- 1106 Tudor St Unit 1106 Tudor
Your Personal Tour Guide
Ask me questions while you tour the home.