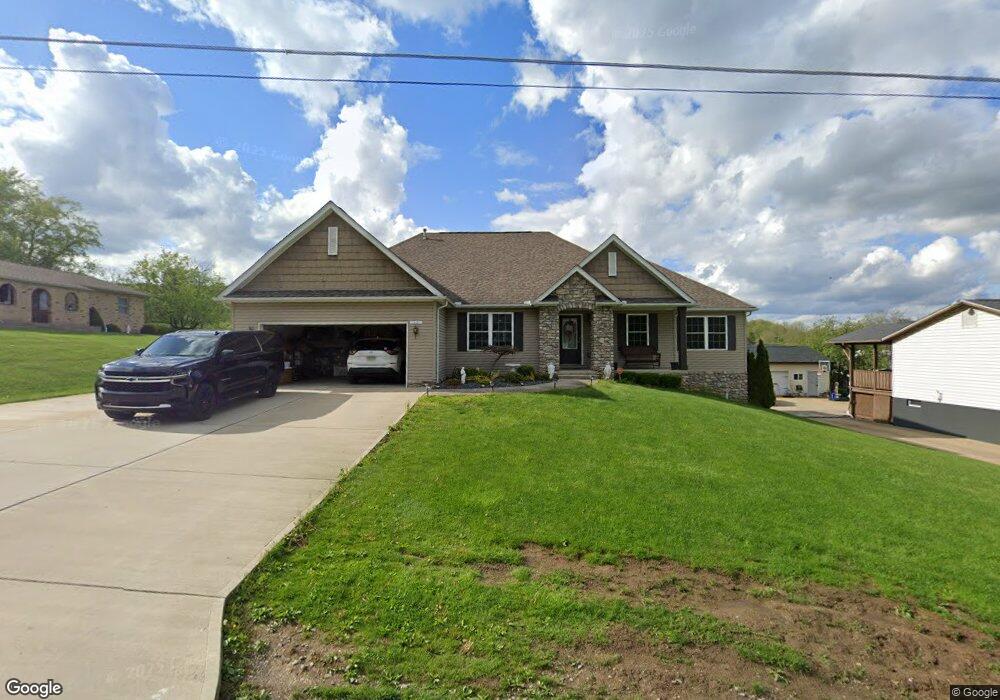
68 Hemlock St Homer City, PA 15748
Estimated Value: $190,000 - $316,489
3
Beds
3
Baths
2,052
Sq Ft
$127/Sq Ft
Est. Value
About This Home
This home is located at 68 Hemlock St, Homer City, PA 15748 and is currently estimated at $260,372, approximately $126 per square foot. 68 Hemlock St is a home with nearby schools including Homer-Center Elementary School and Homer-Center Junior/Senior High School.
Ownership History
Date
Name
Owned For
Owner Type
Purchase Details
Closed on
Mar 19, 2013
Sold by
Tamburrino Melissa Renee
Bought by
Tamburrino Melissa Renee and Tamburrino Joseph A
Current Estimated Value
Home Financials for this Owner
Home Financials are based on the most recent Mortgage that was taken out on this home.
Original Mortgage
$252,543
Outstanding Balance
$178,535
Interest Rate
3.58%
Mortgage Type
FHA
Estimated Equity
$81,837
Purchase Details
Closed on
Aug 21, 2012
Sold by
Ferra Raymond and Ferra Patricia
Bought by
Tamburrino Melissa Renee
Create a Home Valuation Report for This Property
The Home Valuation Report is an in-depth analysis detailing your home's value as well as a comparison with similar homes in the area
Home Values in the Area
Average Home Value in this Area
Purchase History
| Date | Buyer | Sale Price | Title Company |
|---|---|---|---|
| Tamburrino Melissa Renee | -- | None Available | |
| Tamburrino Melissa Renee | -- | None Available |
Source: Public Records
Mortgage History
| Date | Status | Borrower | Loan Amount |
|---|---|---|---|
| Open | Tamburrino Melissa Renee | $252,543 |
Source: Public Records
Tax History Compared to Growth
Tax History
| Year | Tax Paid | Tax Assessment Tax Assessment Total Assessment is a certain percentage of the fair market value that is determined by local assessors to be the total taxable value of land and additions on the property. | Land | Improvement |
|---|---|---|---|---|
| 2025 | $5,326 | $212,500 | $14,800 | $197,700 |
| 2024 | $5,241 | $212,500 | $14,800 | $197,700 |
| 2023 | $4,928 | $212,500 | $14,800 | $197,700 |
| 2022 | $4,876 | $212,500 | $14,800 | $197,700 |
| 2021 | $4,876 | $212,500 | $14,800 | $197,700 |
| 2020 | $4,778 | $212,500 | $14,800 | $197,700 |
| 2018 | $4,719 | $212,500 | $14,800 | $197,700 |
| 2017 | $3,871 | $212,500 | $14,800 | $197,700 |
| 2016 | -- | $212,500 | $14,800 | $197,700 |
| 2015 | -- | $28,230 | $860 | $27,370 |
| 2014 | -- | $860 | $860 | $0 |
Source: Public Records
Map
Nearby Homes