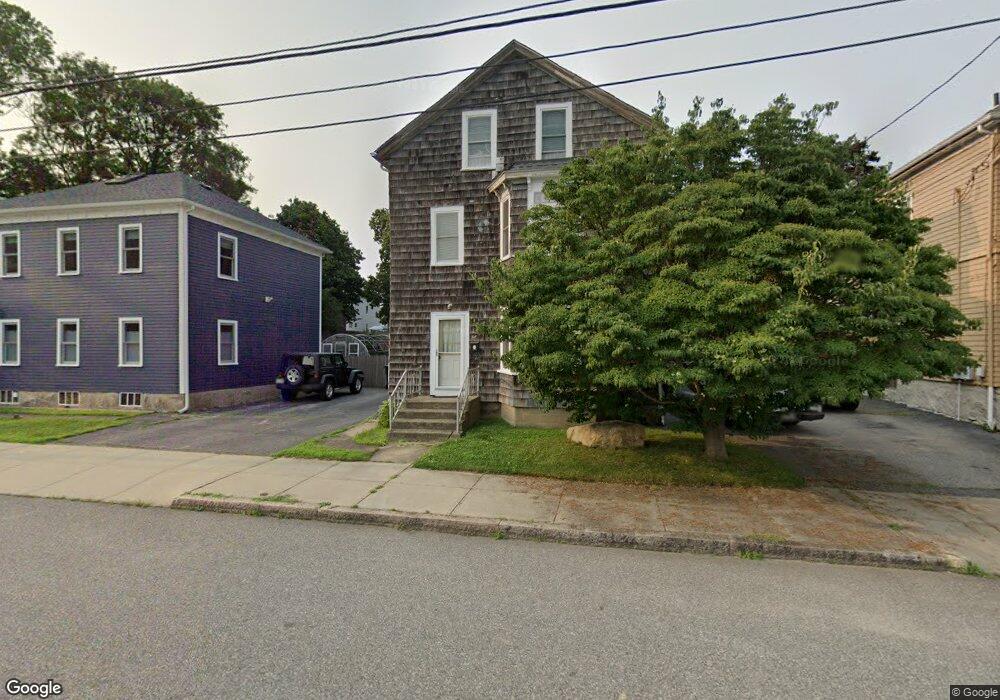
68 Howe St Fall River, MA 02724
Father Kelly NeighborhoodEstimated Value: $391,286 - $486,000
5
Beds
1
Bath
2,295
Sq Ft
$186/Sq Ft
Est. Value
About This Home
This home is located at 68 Howe St, Fall River, MA 02724 and is currently estimated at $426,072, approximately $185 per square foot. 68 Howe St is a home located in Bristol County with nearby schools including Carlton M. Viveiros Elementary School, Matthew J. Kuss Middle School, and B M C Durfee High School.
Ownership History
Date
Name
Owned For
Owner Type
Purchase Details
Closed on
Jul 1, 1988
Sold by
Rapoza Joseph J
Bought by
Daigle Richard
Current Estimated Value
Home Financials for this Owner
Home Financials are based on the most recent Mortgage that was taken out on this home.
Original Mortgage
$75,000
Interest Rate
10.47%
Mortgage Type
Purchase Money Mortgage
Create a Home Valuation Report for This Property
The Home Valuation Report is an in-depth analysis detailing your home's value as well as a comparison with similar homes in the area
Home Values in the Area
Average Home Value in this Area
Purchase History
| Date | Buyer | Sale Price | Title Company |
|---|---|---|---|
| Daigle Richard | $75,000 | -- |
Source: Public Records
Mortgage History
| Date | Status | Borrower | Loan Amount |
|---|---|---|---|
| Open | Daigle Richard | $125,000 | |
| Closed | Daigle Richard | $69,500 | |
| Closed | Daigle Richard | $75,000 |
Source: Public Records
Tax History
| Year | Tax Paid | Tax Assessment Tax Assessment Total Assessment is a certain percentage of the fair market value that is determined by local assessors to be the total taxable value of land and additions on the property. | Land | Improvement |
|---|---|---|---|---|
| 2025 | $3,051 | $266,500 | $108,200 | $158,300 |
| 2024 | $2,863 | $249,200 | $104,200 | $145,000 |
| 2023 | $2,761 | $225,000 | $86,100 | $138,900 |
| 2022 | $2,479 | $196,400 | $82,000 | $114,400 |
| 2021 | $2,429 | $175,600 | $78,000 | $97,600 |
| 2020 | $2,426 | $167,900 | $76,900 | $91,000 |
| 2019 | $2,346 | $160,900 | $74,000 | $86,900 |
| 2018 | $2,409 | $164,800 | $80,200 | $84,600 |
| 2017 | $2,232 | $159,400 | $76,400 | $83,000 |
| 2016 | $2,166 | $158,900 | $81,300 | $77,600 |
| 2015 | $2,133 | $163,100 | $81,300 | $81,800 |
| 2014 | $2,022 | $160,700 | $78,900 | $81,800 |
Source: Public Records
Map
Nearby Homes
- 15 Higgins St
- 57 Larouche St
- 1852 S Main St
- 1846 S Main St
- 2229 S Main St
- 609 King Philip St
- 126 Wheeler St
- 616 Woodman St
- 464 Birch St
- 234 Kilburn St
- 917 Dwelly St
- 30 Broad St
- 245 Dwelly St
- 579 Summit St Unit 3
- 579 Summit St Unit 2
- 20 Wilcox St
- 143 Meeson St
- 250 Laurel St
- 1334 S Main St
- 344-354 E Main St
Your Personal Tour Guide
Ask me questions while you tour the home.