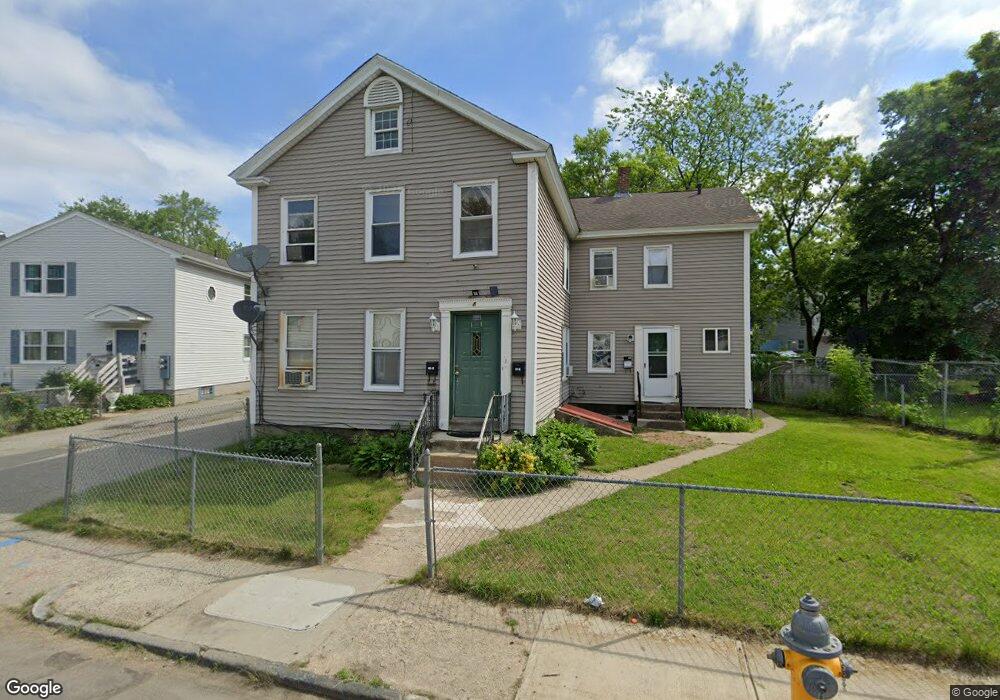
68 James St Unit 70 Springfield, MA 01105
Maple-High Six Corners NeighborhoodEstimated Value: $320,000 - $840,322
8
Beds
3
Baths
2,760
Sq Ft
$166/Sq Ft
Est. Value
About This Home
This home is located at 68 James St Unit 70, Springfield, MA 01105 and is currently estimated at $457,831, approximately $165 per square foot. 68 James St Unit 70 is a home located in Hampden County with nearby schools including Milton Bradley School, M Marcus Kiley Middle, and High School Of Commerce.
Ownership History
Date
Name
Owned For
Owner Type
Purchase Details
Closed on
Mar 17, 2015
Sold by
Houle Raymond
Bought by
68 James Street Rt and Ray&Rae Rental Inc Tr
Current Estimated Value
Purchase Details
Closed on
Feb 24, 2004
Sold by
James Rt and Houle Raymond G
Bought by
Houle Raymond G
Purchase Details
Closed on
Jul 30, 2003
Sold by
Michlan Rt
Bought by
James Rt and Houle Raymond G
Purchase Details
Closed on
Jul 24, 2003
Sold by
Household Finance Corp
Bought by
Michlan Rt and Hallerin Realty Llp
Purchase Details
Closed on
Jan 30, 2003
Sold by
Shattelroe Alfred D
Bought by
Household Finance Corp
Purchase Details
Closed on
Jun 22, 1994
Sold by
Kowalski Barbara C
Bought by
Shattelroe Alfred D
Purchase Details
Closed on
May 17, 1988
Sold by
Sofornko Rhonda A
Bought by
West Commonwealth Dev
Create a Home Valuation Report for This Property
The Home Valuation Report is an in-depth analysis detailing your home's value as well as a comparison with similar homes in the area
Home Values in the Area
Average Home Value in this Area
Purchase History
| Date | Buyer | Sale Price | Title Company |
|---|---|---|---|
| 68 James Street Rt | -- | -- | |
| Houle Raymond G | -- | -- | |
| James Rt | $65,000 | -- | |
| Michlan Rt | $45,000 | -- | |
| Household Finance Corp | $70,129 | -- | |
| Shattelroe Alfred D | $18,000 | -- | |
| West Commonwealth Dev | $182,000 | -- |
Source: Public Records
Mortgage History
| Date | Status | Borrower | Loan Amount |
|---|---|---|---|
| Previous Owner | West Commonwealth Dev | $58,800 | |
| Previous Owner | West Commonwealth Dev | $22,750 | |
| Previous Owner | West Commonwealth Dev | $20,000 |
Source: Public Records
Tax History Compared to Growth
Tax History
| Year | Tax Paid | Tax Assessment Tax Assessment Total Assessment is a certain percentage of the fair market value that is determined by local assessors to be the total taxable value of land and additions on the property. | Land | Improvement |
|---|---|---|---|---|
| 2025 | $3,696 | $235,700 | $24,600 | $211,100 |
| 2024 | $3,548 | $220,900 | $23,000 | $197,900 |
| 2023 | $2,737 | $160,500 | $21,900 | $138,600 |
| 2022 | $3,367 | $178,900 | $19,900 | $159,000 |
| 2021 | $3,119 | $165,000 | $18,100 | $146,900 |
| 2020 | $2,961 | $151,600 | $18,100 | $133,500 |
| 2019 | $3,017 | $153,300 | $18,100 | $135,200 |
| 2018 | $2,706 | $137,500 | $18,100 | $119,400 |
| 2017 | $2,642 | $134,400 | $14,500 | $119,900 |
| 2016 | $2,400 | $122,100 | $14,500 | $107,600 |
| 2015 | $2,339 | $118,900 | $14,500 | $104,400 |
Source: Public Records
Map
Nearby Homes
- 128 Cedar St
- 64-66 James St
- 64 James St Unit 66
- 132 Cedar St Unit 134
- 79 James St
- 118 Cedar St
- 60 James St
- 71 James St
- 138 Cedar St
- 56 James St
- 55-57 James St
- 55 James St Unit 57
- 142 Cedar St
- 104 Cedar St Unit 2
- 104 Cedar St
- 104 Cedar St Unit 1
- 87 Cedar St
- 51-53 James St
- 117 Cedar St
- 51 James St Unit 53