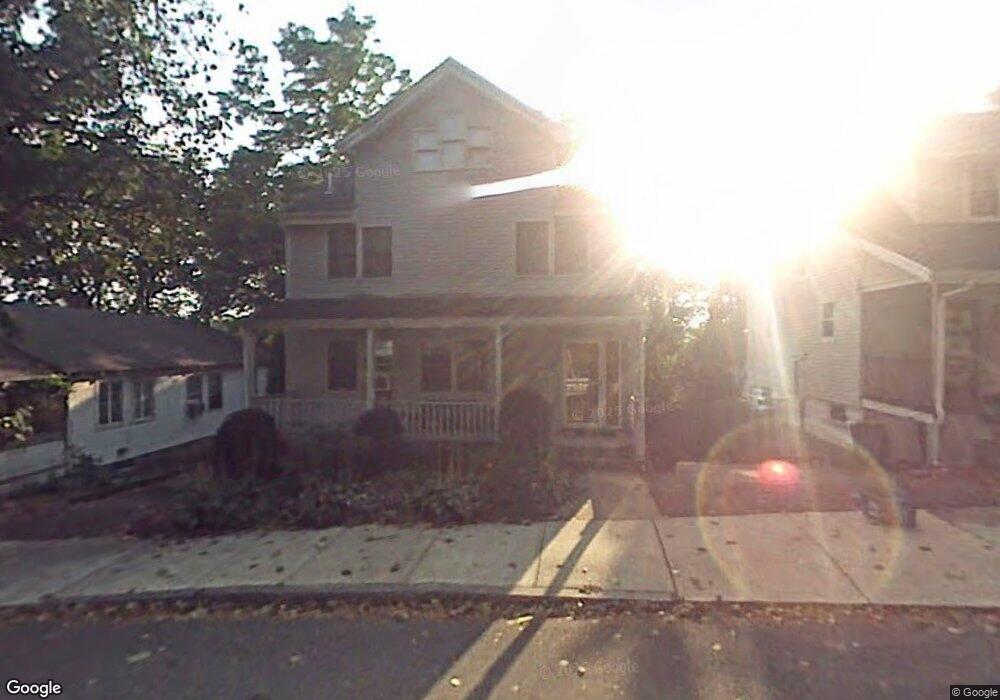
68 Larch St Brighton, MA 02135
Brighton NeighborhoodEstimated Value: $1,168,000 - $1,245,000
3
Beds
3
Baths
2,596
Sq Ft
$467/Sq Ft
Est. Value
About This Home
This home is located at 68 Larch St, Brighton, MA 02135 and is currently estimated at $1,211,150, approximately $466 per square foot. 68 Larch St is a home located in Suffolk County with nearby schools including Shaloh House Jewish Day School and St Columbkille Partnership School.
Ownership History
Date
Name
Owned For
Owner Type
Purchase Details
Closed on
Dec 11, 2024
Sold by
Chan Ping C
Bought by
Pcc Rt and Chan
Current Estimated Value
Purchase Details
Closed on
Jun 5, 1987
Sold by
Turner Joseph C
Bought by
Chan Henry L
Home Financials for this Owner
Home Financials are based on the most recent Mortgage that was taken out on this home.
Original Mortgage
$147,000
Interest Rate
10.38%
Mortgage Type
Purchase Money Mortgage
Create a Home Valuation Report for This Property
The Home Valuation Report is an in-depth analysis detailing your home's value as well as a comparison with similar homes in the area
Home Values in the Area
Average Home Value in this Area
Purchase History
| Date | Buyer | Sale Price | Title Company |
|---|---|---|---|
| Pcc Rt | -- | None Available | |
| Pcc Rt | -- | None Available | |
| Chan Henry L | $220,000 | -- |
Source: Public Records
Mortgage History
| Date | Status | Borrower | Loan Amount |
|---|---|---|---|
| Previous Owner | Chan Henry L | $147,000 |
Source: Public Records
Tax History
| Year | Tax Paid | Tax Assessment Tax Assessment Total Assessment is a certain percentage of the fair market value that is determined by local assessors to be the total taxable value of land and additions on the property. | Land | Improvement |
|---|---|---|---|---|
| 2025 | $13,783 | $1,190,200 | $272,500 | $917,700 |
| 2024 | $12,549 | $1,151,300 | $240,200 | $911,100 |
| 2023 | $12,186 | $1,134,600 | $240,200 | $894,400 |
| 2022 | $11,223 | $1,031,500 | $218,400 | $813,100 |
| 2021 | $10,889 | $1,020,500 | $218,400 | $802,100 |
| 2020 | $8,498 | $804,700 | $191,400 | $613,300 |
| 2019 | $8,153 | $773,500 | $157,800 | $615,700 |
| 2018 | $7,647 | $729,700 | $157,800 | $571,900 |
| 2017 | $7,728 | $729,700 | $157,800 | $571,900 |
| 2016 | $7,297 | $663,400 | $157,800 | $505,600 |
| 2015 | $7,172 | $592,200 | $167,400 | $424,800 |
| 2014 | $7,025 | $558,400 | $167,400 | $391,000 |
Source: Public Records
Map
Nearby Homes
- 27 S Crescent Circuit Crescent
- 19 Crescent Circuit Crescent S
- 64 Larch St
- 34 Larch St Unit 34
- 32-34 Larch St
- 32 Larch St Unit 34
- 48 Nonantum St
- 18 Breck Ave Unit 18
- 96 Brayton Rd
- 571-575 Washington St
- 116 Lake Shore Rd Unit 4
- 12 Mina Way
- 99 Tremont St Unit 206
- 99 Tremont St Unit 105
- 99 Tremont St Unit 513
- 6-8 Cenacle Rd
- 61 Huntington Rd
- 143 Tremont St Unit A
- 143 Tremont St Unit 2
- 21 Upcrest Rd
- 70 Larch St
- 70 Larch St
- 70 Larch St Unit 1
- 25 Brayton Rd Unit 25
- 23-25 Brayton Rd
- 29 Brayton Rd
- 60 Larch St
- 19 Brayton Rd
- 23 Brayton Rd
- 23 Brayton Rd Unit 25
- 23 Brayton Rd Unit 23
- 63 Larch St
- 33 Brayton Rd
- 33 Brayton Rd
- 33 Brayton Rd Unit 1
- 15 Brayton Rd
- 78 Larch St
- 27 S Crescent Circuit
- 27 S Crescent Circuit Unit 2
- 27 S Crescent Circuit Unit 1
Your Personal Tour Guide
Ask me questions while you tour the home.