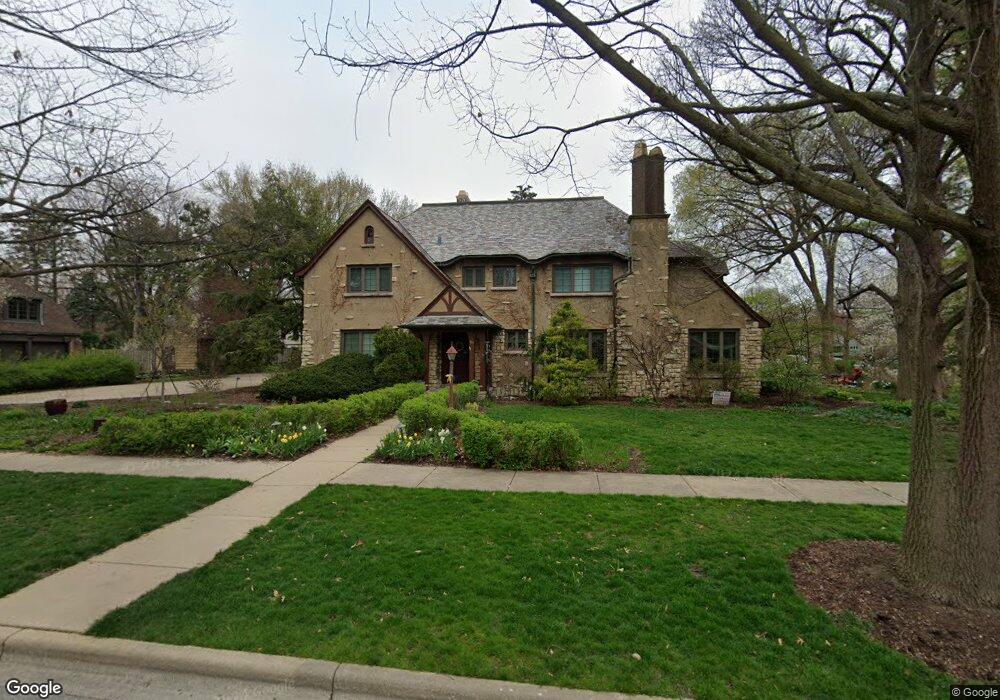
68 Le Grande Blvd Aurora, IL 60506
Blackhawk NeighborhoodEstimated Value: $497,000 - $630,000
4
Beds
4
Baths
4,156
Sq Ft
$143/Sq Ft
Est. Value
About This Home
This home is located at 68 Le Grande Blvd, Aurora, IL 60506 and is currently estimated at $593,136, approximately $142 per square foot. 68 Le Grande Blvd is a home located in Kane County with nearby schools including Freeman Elementary School, Washington Middle School, and West Aurora High School.
Ownership History
Date
Name
Owned For
Owner Type
Purchase Details
Closed on
Nov 24, 2010
Sold by
Lindgren Meredith N
Bought by
Lindgren Bruce E and Lindgren Meredith N
Current Estimated Value
Purchase Details
Closed on
Jun 10, 2009
Sold by
Lindgren Bruce E and Lindgren Meredith N
Bought by
Lindgren Meredith N
Purchase Details
Closed on
Jan 5, 1995
Sold by
Schierer Gregory A and Schierer Elizabeth D
Bought by
Lindgren Bruce E and Lindgren Meredith N
Home Financials for this Owner
Home Financials are based on the most recent Mortgage that was taken out on this home.
Original Mortgage
$100,000
Interest Rate
9.27%
Create a Home Valuation Report for This Property
The Home Valuation Report is an in-depth analysis detailing your home's value as well as a comparison with similar homes in the area
Home Values in the Area
Average Home Value in this Area
Purchase History
| Date | Buyer | Sale Price | Title Company |
|---|---|---|---|
| Lindgren Bruce E | -- | None Available | |
| Lindgren Meredith N | -- | None Available | |
| Lindgren Bruce E | $350,500 | First American Title Ins Co |
Source: Public Records
Mortgage History
| Date | Status | Borrower | Loan Amount |
|---|---|---|---|
| Closed | Lindgren Bruce E | $100,000 |
Source: Public Records
Tax History Compared to Growth
Tax History
| Year | Tax Paid | Tax Assessment Tax Assessment Total Assessment is a certain percentage of the fair market value that is determined by local assessors to be the total taxable value of land and additions on the property. | Land | Improvement |
|---|---|---|---|---|
| 2024 | $15,845 | $208,110 | $35,084 | $173,026 |
| 2023 | $15,242 | $185,945 | $31,347 | $154,598 |
| 2022 | $14,487 | $169,658 | $28,601 | $141,057 |
| 2021 | $13,883 | $157,954 | $26,628 | $131,326 |
| 2020 | $14,346 | $159,242 | $24,733 | $134,509 |
| 2019 | $13,841 | $147,542 | $22,916 | $124,626 |
| 2018 | $14,007 | $146,307 | $21,197 | $125,110 |
| 2017 | $15,880 | $160,295 | $19,531 | $140,764 |
| 2016 | $16,677 | $162,984 | $16,742 | $146,242 |
| 2015 | -- | $162,635 | $14,397 | $148,238 |
| 2014 | -- | $155,802 | $13,231 | $142,571 |
| 2013 | -- | $149,601 | $13,308 | $136,293 |
Source: Public Records
Map
Nearby Homes
- 149 S Gladstone Ave
- 164 S Calumet Ave
- 931 W Downer Place
- 203 S Calumet Ave
- 231 W Downer Place
- 237 Ingleside Ave
- 930 W New York St Unit 932
- 175 S Harrison Ave
- 850 W Galena Blvd
- 943 Charles St
- 900 Charles St
- 425 Ingleside Ave
- 710 W Downer Place
- 809 W Park Ave
- 115 Hillwood Place Unit 4B
- 113 Stonewood Place Unit 6D
- 537 Hartford Ave
- 1143 Ridgeway Ave
- 823 Lenwood Ct
- 1730 W Galena Blvd Unit 402E
- 1135 Garfield Ave
- 50 Le Grande Blvd
- 77 S Commonwealth Ave
- 55 S Commonwealth Ave
- 61 Le Grande Blvd
- 106 Le Grande Blvd
- 1140 Garfield Ave
- 1211 Garfield Ave
- 1132 Garfield Ave
- 1204 Garfield Ave
- 1210 W Downer Place
- 112 Le Grande Blvd
- 111 Le Grande Blvd
- 115 S Commonwealth Ave
- 1153 W Downer Place
- 1147 W Downer Place
- 1120 W Downer Place
- 70 S Gladstone Ave
- 1122 Garfield Ave
- 1214 Garfield Ave