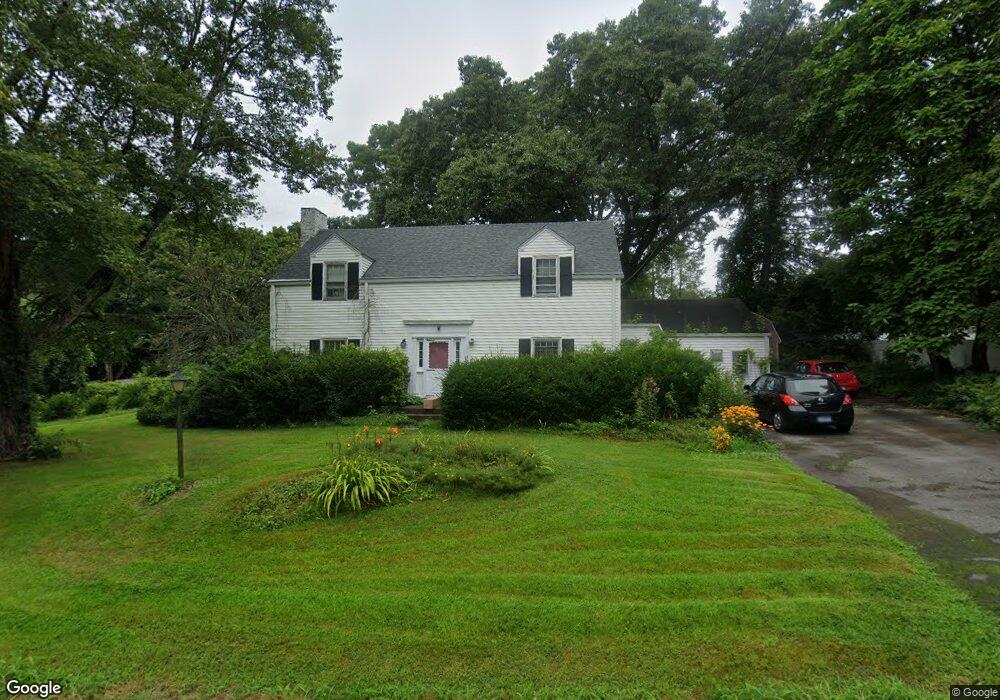
68 Lhomme St Danielson, CT 06239
Estimated Value: $372,000 - $388,000
2
Beds
3
Baths
2,244
Sq Ft
$168/Sq Ft
Est. Value
About This Home
This home is located at 68 Lhomme St, Danielson, CT 06239 and is currently estimated at $377,512, approximately $168 per square foot. 68 Lhomme St is a home located in Windham County with nearby schools including Killingly Central School, Killingly Memorial School, and Killingly Intermediate School.
Ownership History
Date
Name
Owned For
Owner Type
Purchase Details
Closed on
Oct 2, 1998
Sold by
Harrigan James P
Bought by
Peloquin Paula S
Current Estimated Value
Purchase Details
Closed on
Nov 25, 1996
Sold by
Harrigan James P
Bought by
Peloquin Paula S
Home Financials for this Owner
Home Financials are based on the most recent Mortgage that was taken out on this home.
Original Mortgage
$87,800
Interest Rate
7.81%
Purchase Details
Closed on
Jul 29, 1993
Sold by
Upham Stephen M and Upham Kathryn
Bought by
Harrington James P
Home Financials for this Owner
Home Financials are based on the most recent Mortgage that was taken out on this home.
Original Mortgage
$131,200
Interest Rate
7.32%
Mortgage Type
Unknown
Create a Home Valuation Report for This Property
The Home Valuation Report is an in-depth analysis detailing your home's value as well as a comparison with similar homes in the area
Home Values in the Area
Average Home Value in this Area
Purchase History
| Date | Buyer | Sale Price | Title Company |
|---|---|---|---|
| Peloquin Paula S | $109,750 | -- | |
| Peloquin Paula S | $109,750 | -- | |
| Peloquin Paula S | $109,750 | -- | |
| Peloquin Paula S | $109,750 | -- | |
| Harrington James P | $132,000 | -- | |
| Harrington James P | $132,000 | -- |
Source: Public Records
Mortgage History
| Date | Status | Borrower | Loan Amount |
|---|---|---|---|
| Previous Owner | Harrington James P | $87,800 | |
| Previous Owner | Harrington James P | $131,200 |
Source: Public Records
Tax History
| Year | Tax Paid | Tax Assessment Tax Assessment Total Assessment is a certain percentage of the fair market value that is determined by local assessors to be the total taxable value of land and additions on the property. | Land | Improvement |
|---|---|---|---|---|
| 2025 | $4,615 | $210,450 | $28,970 | $181,480 |
| 2024 | $4,377 | $210,450 | $28,970 | $181,480 |
| 2023 | $4,214 | $152,890 | $23,850 | $129,040 |
| 2022 | $3,968 | $153,930 | $24,890 | $129,040 |
| 2021 | $3,841 | $149,240 | $24,920 | $124,320 |
| 2020 | $3,764 | $149,240 | $24,920 | $124,320 |
| 2019 | $3,812 | $149,240 | $24,920 | $124,320 |
| 2017 | $3,308 | $118,300 | $15,960 | $102,340 |
| 2016 | $3,316 | $118,300 | $15,960 | $102,340 |
| 2015 | $3,311 | $118,300 | $15,960 | $102,340 |
| 2014 | $3,219 | $118,300 | $15,960 | $102,340 |
Source: Public Records
Map
Nearby Homes
Your Personal Tour Guide
Ask me questions while you tour the home.