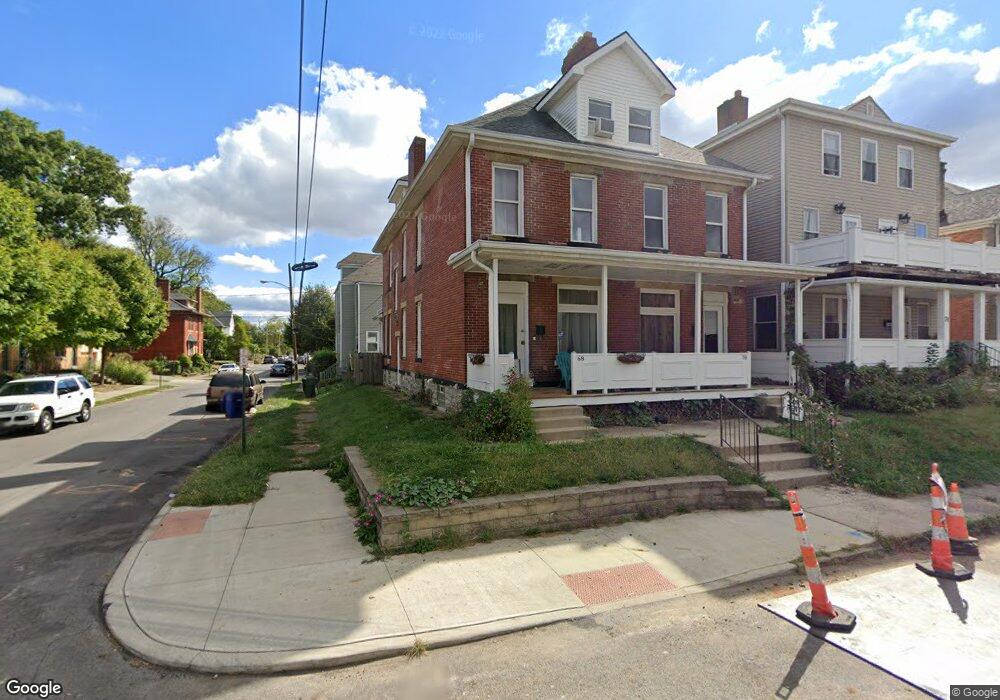
68 Linwood Ave Unit 70 Columbus, OH 43205
Franklin Park NeighborhoodEstimated Value: $393,000 - $483,000
6
Beds
2
Baths
3,796
Sq Ft
$116/Sq Ft
Est. Value
About This Home
This home is located at 68 Linwood Ave Unit 70, Columbus, OH 43205 and is currently estimated at $441,861, approximately $116 per square foot. 68 Linwood Ave Unit 70 is a home located in Franklin County with nearby schools including Ohio Avenue Elementary School, Champion Middle School, and East High School.
Ownership History
Date
Name
Owned For
Owner Type
Purchase Details
Closed on
Jan 17, 2006
Sold by
Anderson Michael P and Renae Anderson D
Bought by
Fletcher Harold Eugene
Current Estimated Value
Home Financials for this Owner
Home Financials are based on the most recent Mortgage that was taken out on this home.
Original Mortgage
$71,100
Interest Rate
6.42%
Mortgage Type
Fannie Mae Freddie Mac
Purchase Details
Closed on
Nov 14, 1997
Sold by
Woodford Carl H
Bought by
Anderson Michael P
Purchase Details
Closed on
Jul 14, 1997
Sold by
Aries Construction Inc and Hall Bobbie M
Bought by
Woodford Carl H and Ford Preston O
Create a Home Valuation Report for This Property
The Home Valuation Report is an in-depth analysis detailing your home's value as well as a comparison with similar homes in the area
Home Values in the Area
Average Home Value in this Area
Purchase History
| Date | Buyer | Sale Price | Title Company |
|---|---|---|---|
| Fletcher Harold Eugene | $79,000 | Amerititle | |
| Anderson Michael P | $8,300 | Chicago Title | |
| Woodford Carl H | $8,300 | Chicago Title | |
| Woodford Carl H | $4,100 | -- |
Source: Public Records
Mortgage History
| Date | Status | Borrower | Loan Amount |
|---|---|---|---|
| Closed | Fletcher Harold Eugene | $71,100 |
Source: Public Records
Tax History Compared to Growth
Tax History
| Year | Tax Paid | Tax Assessment Tax Assessment Total Assessment is a certain percentage of the fair market value that is determined by local assessors to be the total taxable value of land and additions on the property. | Land | Improvement |
|---|---|---|---|---|
| 2024 | $7,760 | $100,320 | $32,730 | $67,590 |
| 2023 | $4,540 | $100,310 | $32,725 | $67,585 |
| 2022 | $4,566 | $62,690 | $5,360 | $57,330 |
| 2021 | $3,944 | $62,690 | $5,360 | $57,330 |
| 2020 | $3,501 | $62,690 | $5,360 | $57,330 |
| 2019 | $3,117 | $50,120 | $4,270 | $45,850 |
| 2018 | $2,080 | $50,120 | $4,270 | $45,850 |
| 2017 | $1,497 | $50,120 | $4,270 | $45,850 |
| 2016 | $3,482 | $51,250 | $3,680 | $47,570 |
| 2015 | $3,170 | $51,250 | $3,680 | $47,570 |
| 2014 | $3,178 | $51,250 | $3,680 | $47,570 |
| 2013 | $1,424 | $46,550 | $3,325 | $43,225 |
Source: Public Records
Map
Nearby Homes
- 1262 Fair Ave
- 1318 Oak St
- 39 Auburn Ave
- 43 Winner Ave
- 1214 Madison Ave
- 1258 Oak St
- 1029 Franklin Ave
- 90-92 Burt St Unit 90
- 1217 Franklin Ave Unit 219
- 1275 E Long St
- 1271 E Long St
- 838 Bryden Rd
- 1455 Franklin Ave
- 1179 Franklin Ave
- 238-240 Miller Ave
- 1318 E Long St
- 1304 E Long St
- 266 Miller Ave Unit 268
- 156 Winner Ave
- 122 S Ohio Ave Unit 2
- 70 Linwood Ave
- 68-70 Linwood Ave
- 74 Linwood Ave
- 1363 Madison Ave Unit 365
- 78 Linwood Ave
- 84 Linwood Ave Unit 53
- 67 Linwood Ave
- 88 Linwood Ave
- 55 Linwood Ave
- 92 Linwood Ave
- 81 Linwood Ave
- 63 Latta Ave
- 1330 Madison Ave
- 87 Linwood Ave
- 95 Latta Ave
- 59 Latta Ave
- 39 Linwood Ave
- 43 Linwood Ave
- 91 Linwood Ave
- 53 Latta Ave