68 Locust St Oxford, MA 01540
Estimated Value: $390,000 - $444,000
3
Beds
1
Bath
1,312
Sq Ft
$318/Sq Ft
Est. Value
About This Home
This home is located at 68 Locust St, Oxford, MA 01540 and is currently estimated at $417,255, approximately $318 per square foot. 68 Locust St is a home located in Worcester County with nearby schools including Alfred M Chaffee, Oxford High School, and Clara Barton Elementary School.
Ownership History
Date
Name
Owned For
Owner Type
Purchase Details
Closed on
Jan 5, 2012
Sold by
Murray John E and Pupka Patricia
Bought by
Pupka Robert G and Pupka Patricia
Current Estimated Value
Home Financials for this Owner
Home Financials are based on the most recent Mortgage that was taken out on this home.
Original Mortgage
$100,000
Outstanding Balance
$68,557
Interest Rate
3.98%
Mortgage Type
New Conventional
Estimated Equity
$348,698
Create a Home Valuation Report for This Property
The Home Valuation Report is an in-depth analysis detailing your home's value as well as a comparison with similar homes in the area
Home Values in the Area
Average Home Value in this Area
Purchase History
| Date | Buyer | Sale Price | Title Company |
|---|---|---|---|
| Pupka Robert G | -- | -- |
Source: Public Records
Mortgage History
| Date | Status | Borrower | Loan Amount |
|---|---|---|---|
| Open | Pupka Robert G | $100,000 |
Source: Public Records
Tax History
| Year | Tax Paid | Tax Assessment Tax Assessment Total Assessment is a certain percentage of the fair market value that is determined by local assessors to be the total taxable value of land and additions on the property. | Land | Improvement |
|---|---|---|---|---|
| 2025 | $4,391 | $346,600 | $86,400 | $260,200 |
| 2024 | $4,469 | $331,500 | $82,300 | $249,200 |
| 2023 | $4,261 | $312,400 | $78,700 | $233,700 |
| 2022 | $3,941 | $243,900 | $77,100 | $166,800 |
| 2021 | $3,774 | $228,300 | $73,200 | $155,100 |
| 2020 | $3,625 | $217,600 | $73,200 | $144,400 |
| 2019 | $3,365 | $197,600 | $73,200 | $124,400 |
| 2018 | $3,243 | $187,800 | $73,200 | $114,600 |
| 2017 | $3,190 | $189,300 | $70,100 | $119,200 |
| 2016 | $3,205 | $189,300 | $70,100 | $119,200 |
| 2015 | $2,989 | $189,300 | $70,100 | $119,200 |
| 2014 | $2,901 | $193,400 | $68,300 | $125,100 |
Source: Public Records
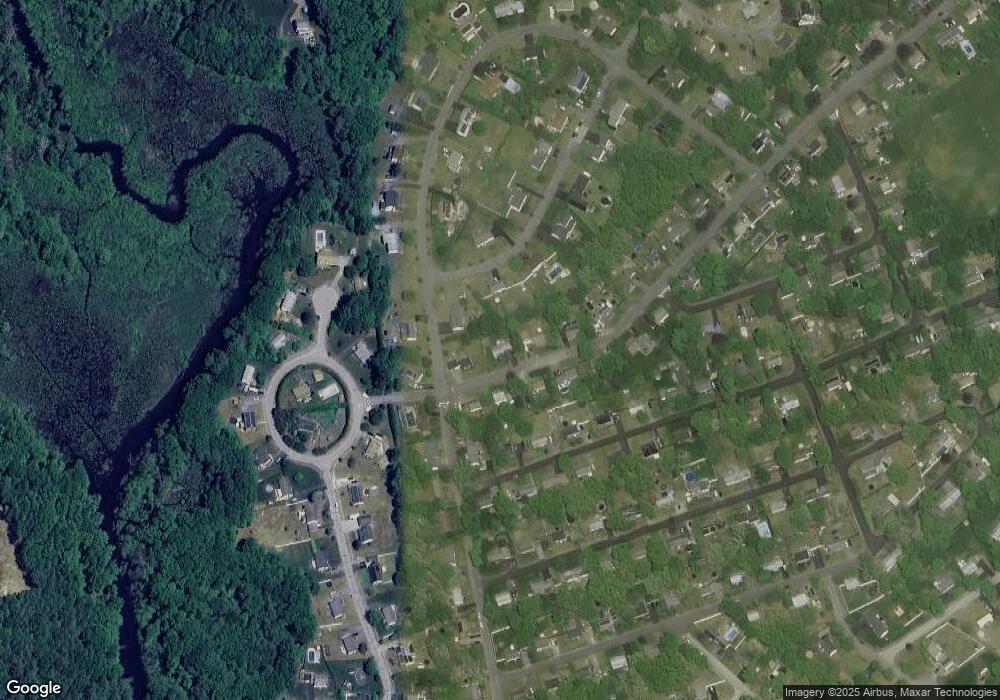
Map
Nearby Homes
Your Personal Tour Guide
Ask me questions while you tour the home.