Estimated Value: $489,000 - $574,000
4
Beds
2
Baths
2,968
Sq Ft
$175/Sq Ft
Est. Value
About This Home
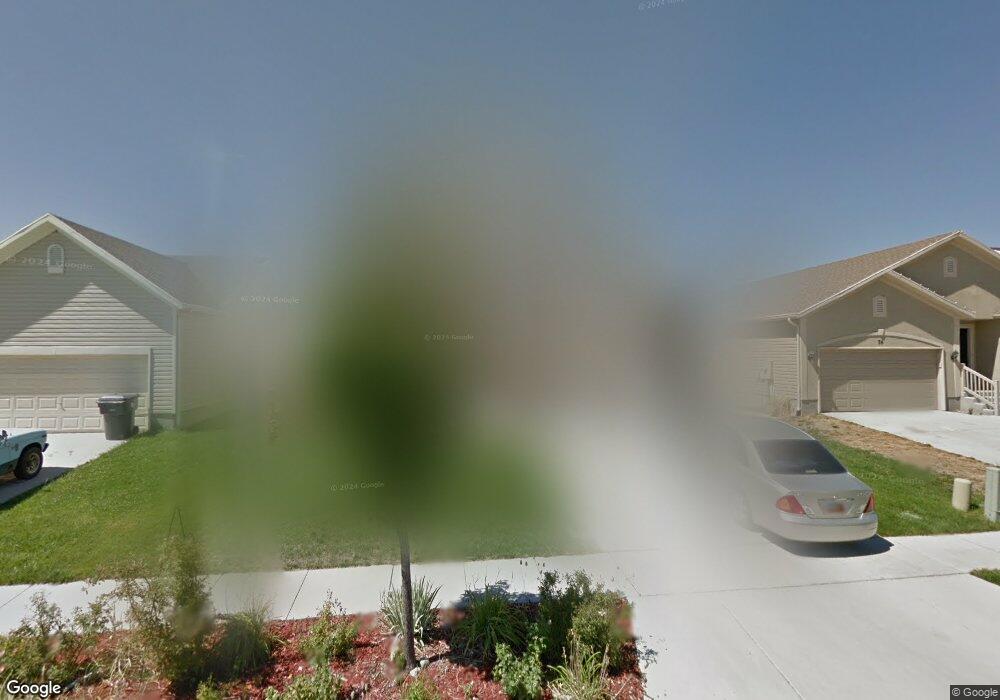
This home is located at 68 N Kintail St, Lehi, UT 84043 and is currently estimated at $520,275, approximately $175 per square foot. 68 N Kintail St is a home located in Utah County with nearby schools including Dry Creek Elementary School, Lehi Junior High School, and Lehi High School.
Ownership History
Date
Name
Owned For
Owner Type
Purchase Details
Closed on
Jul 16, 2015
Sold by
Carlin Paul F
Bought by
Carlin Paul
Current Estimated Value
Home Financials for this Owner
Home Financials are based on the most recent Mortgage that was taken out on this home.
Original Mortgage
$188,415
Outstanding Balance
$110,376
Interest Rate
3.98%
Mortgage Type
New Conventional
Estimated Equity
$409,899
Purchase Details
Closed on
Oct 28, 2006
Sold by
Carlin Frederick R
Bought by
Carlin Paul F
Home Financials for this Owner
Home Financials are based on the most recent Mortgage that was taken out on this home.
Original Mortgage
$192,750
Interest Rate
6.3%
Mortgage Type
Purchase Money Mortgage
Purchase Details
Closed on
Dec 1, 2004
Sold by
Loch Lomond Llc
Bought by
Carlin Paul F and Carlin Frederick R
Home Financials for this Owner
Home Financials are based on the most recent Mortgage that was taken out on this home.
Original Mortgage
$167,890
Interest Rate
5.64%
Mortgage Type
Purchase Money Mortgage
Create a Home Valuation Report for This Property
The Home Valuation Report is an in-depth analysis detailing your home's value as well as a comparison with similar homes in the area
Home Values in the Area
Average Home Value in this Area
Purchase History
| Date | Buyer | Sale Price | Title Company |
|---|---|---|---|
| Carlin Paul | -- | Inwest Title | |
| Carlin Paul F | -- | Charity Title Insurance Age | |
| Carlin Paul F | -- | Us Title Utah |
Source: Public Records
Mortgage History
| Date | Status | Borrower | Loan Amount |
|---|---|---|---|
| Open | Carlin Paul | $188,415 | |
| Closed | Carlin Paul F | $192,750 | |
| Previous Owner | Carlin Paul F | $167,890 |
Source: Public Records
Tax History Compared to Growth
Tax History
| Year | Tax Paid | Tax Assessment Tax Assessment Total Assessment is a certain percentage of the fair market value that is determined by local assessors to be the total taxable value of land and additions on the property. | Land | Improvement |
|---|---|---|---|---|
| 2025 | $2,089 | $249,645 | $161,400 | $292,500 |
| 2024 | $2,089 | $250,635 | $0 | $0 |
| 2023 | $2,025 | $261,140 | $0 | $0 |
| 2022 | $2,038 | $256,300 | $0 | $0 |
| 2021 | $1,872 | $351,400 | $93,400 | $258,000 |
| 2020 | $1,777 | $327,600 | $86,500 | $241,100 |
| 2019 | $1,653 | $315,600 | $86,500 | $229,100 |
| 2018 | $1,615 | $290,900 | $82,200 | $208,700 |
| 2017 | $1,500 | $144,485 | $0 | $0 |
| 2016 | $1,538 | $137,555 | $0 | $0 |
| 2015 | $1,457 | $123,585 | $0 | $0 |
| 2014 | $1,385 | $116,105 | $0 | $0 |
Source: Public Records
Map
Nearby Homes
- 72 N Montrose Ln
- 77 N Richmond Ln
- 178 N Husker Ln Unit 2
- Willow Plan at Freedom View Cove
- Oak Plan at Freedom View Cove
- 218 N Husker Ln
- 181 N Husker Ln
- 193 N Husker Ln
- 242 N Husker Ln Unit 8
- Willow Plan at North Lake Meadows
- Juniper Plan at North Lake Meadows
- Longleaf Plan at North Lake Meadows
- Maple Plan at North Lake Meadows
- Oak Plan at North Lake Meadows
- Cypress Plan at North Lake Meadows
- 1967 E 145 N
- 1591 S 1740 W
- 187 N Mia Cove Unit 13
- 1526 E Livi Ln Unit 9
- 1406 1960 W
- 58 N Kintail St
- 74 N Kintail St
- 74 Kintail St
- 69 Kintail St
- 84 Kintail St
- 41 Kintail St
- 52 N Kintail St
- 52 N Kintail St
- 69 N Kintail St
- 57 Kintail St
- 57 N Kintail St
- 77 N Kintail St Unit 334
- 42 N Kintail St
- 94 Kintail St
- 94 N Kintail St
- 42 Kintail St
- 77 N Kintail St
- 49 N Kintail St
- 87 N Kintail St
- 32 N Kintail St