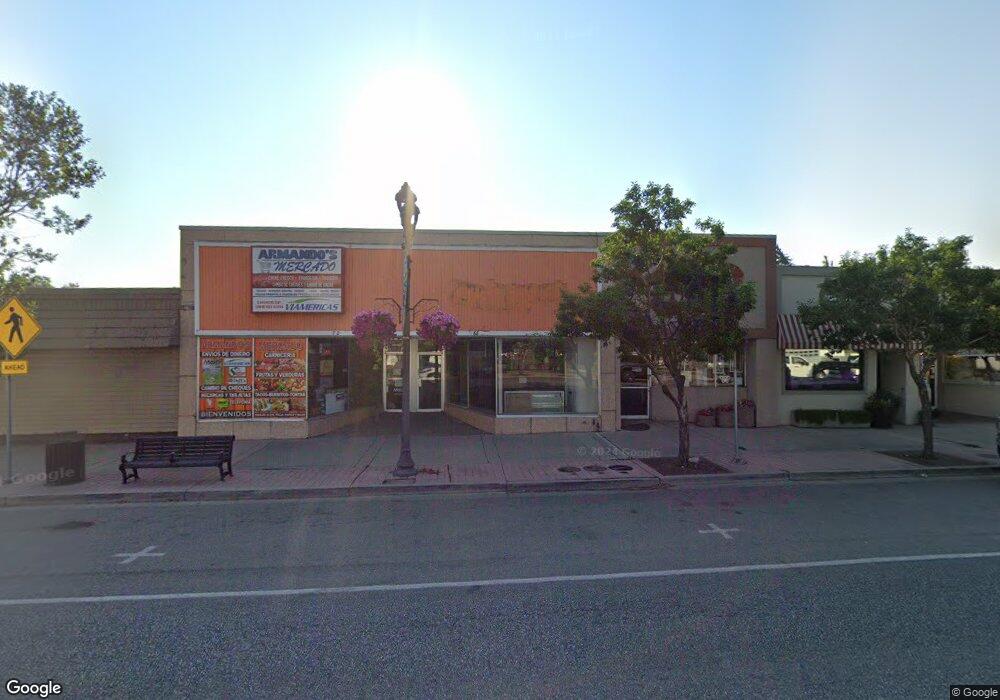
68 N Main St Heber City, UT 84032
Estimated Value: $1,308,000 - $1,613,000
--
Bed
--
Bath
5,059
Sq Ft
$280/Sq Ft
Est. Value
About This Home
This home is located at 68 N Main St, Heber City, UT 84032 and is currently estimated at $1,417,536, approximately $280 per square foot. 68 N Main St is a home located in Wasatch County with nearby schools including J.R. Smith Elementary School and Wasatch High School.
Ownership History
Date
Name
Owned For
Owner Type
Purchase Details
Closed on
Jul 8, 2016
Sold by
Molina Armando Casino
Bought by
Casiano Luna Armand and Margarita Molina Margarita De Jesus
Current Estimated Value
Purchase Details
Closed on
Mar 22, 2013
Sold by
Harry Hoody Llc
Bought by
Molina Armando Casiano
Purchase Details
Closed on
Sep 29, 2006
Sold by
Markwick Sherry L
Bought by
Kren Edward
Home Financials for this Owner
Home Financials are based on the most recent Mortgage that was taken out on this home.
Original Mortgage
$250,000
Interest Rate
6.53%
Mortgage Type
Purchase Money Mortgage
Create a Home Valuation Report for This Property
The Home Valuation Report is an in-depth analysis detailing your home's value as well as a comparison with similar homes in the area
Home Values in the Area
Average Home Value in this Area
Purchase History
| Date | Buyer | Sale Price | Title Company |
|---|---|---|---|
| Casiano Luna Armand | -- | None Available | |
| Molina Armando Casiano | -- | None Available | |
| Kren Edward | -- | Atlas Title Insurance |
Source: Public Records
Mortgage History
| Date | Status | Borrower | Loan Amount |
|---|---|---|---|
| Previous Owner | Kren Edward | $250,000 |
Source: Public Records
Tax History Compared to Growth
Tax History
| Year | Tax Paid | Tax Assessment Tax Assessment Total Assessment is a certain percentage of the fair market value that is determined by local assessors to be the total taxable value of land and additions on the property. | Land | Improvement |
|---|---|---|---|---|
| 2025 | $10,642 | $1,410,000 | $180,000 | $1,230,000 |
| 2024 | $10,642 | $1,410,000 | $180,000 | $1,230,000 |
| 2023 | $10,642 | $284,727 | $139,392 | $145,335 |
| 2022 | $2,881 | $284,727 | $139,392 | $145,335 |
| 2021 | $3,397 | $266,705 | $121,370 | $145,335 |
| 2020 | $3,489 | $266,705 | $121,370 | $145,335 |
| 2019 | $3,305 | $266,705 | $0 | $0 |
| 2018 | $3,305 | $266,705 | $0 | $0 |
| 2017 | $3,323 | $266,705 | $0 | $0 |
| 2016 | $3,412 | $266,705 | $0 | $0 |
| 2015 | $3,255 | $266,705 | $121,370 | $145,335 |
| 2014 | $3,105 | $252,196 | $121,370 | $130,826 |
Source: Public Records
Map
Nearby Homes