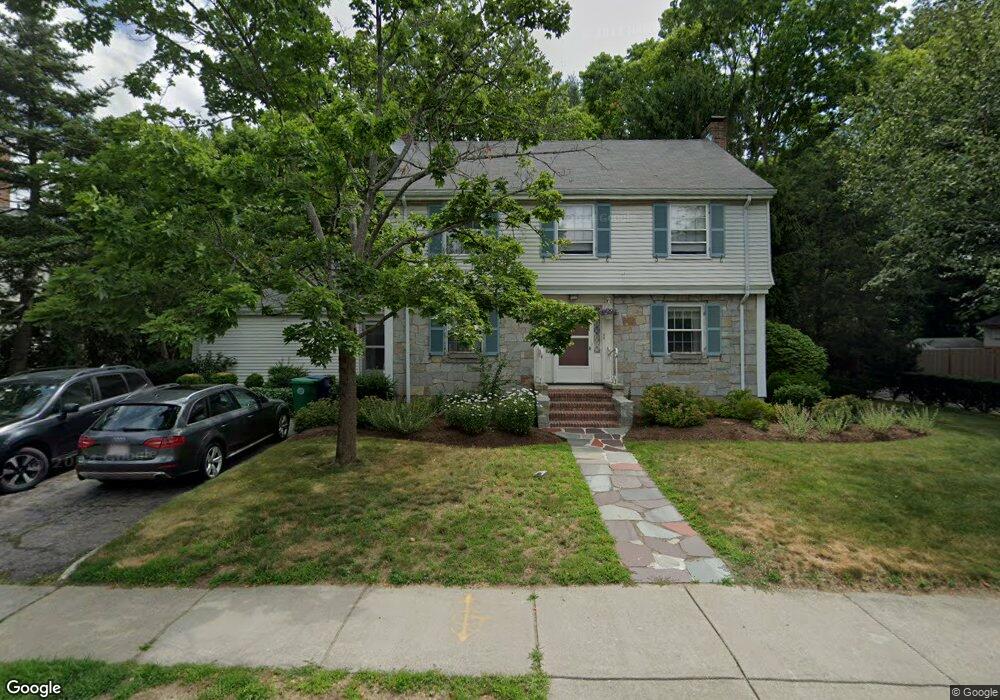
68 Olde Field Rd Newton Center, MA 02459
Thompsonville NeighborhoodEstimated Value: $1,437,000 - $1,684,000
3
Beds
3
Baths
1,992
Sq Ft
$790/Sq Ft
Est. Value
About This Home
This home is located at 68 Olde Field Rd, Newton Center, MA 02459 and is currently estimated at $1,572,764, approximately $789 per square foot. 68 Olde Field Rd is a home located in Middlesex County with nearby schools including Bowen School, Countryside Elementary School, and Charles E Brown Middle School.
Ownership History
Date
Name
Owned For
Owner Type
Purchase Details
Closed on
Aug 30, 1991
Sold by
Rossetti John R and Rossetti Mary G
Bought by
Rajkowski Joseph M and Sheehan Patricia
Current Estimated Value
Home Financials for this Owner
Home Financials are based on the most recent Mortgage that was taken out on this home.
Original Mortgage
$191,250
Interest Rate
9.44%
Mortgage Type
Purchase Money Mortgage
Create a Home Valuation Report for This Property
The Home Valuation Report is an in-depth analysis detailing your home's value as well as a comparison with similar homes in the area
Home Values in the Area
Average Home Value in this Area
Purchase History
| Date | Buyer | Sale Price | Title Company |
|---|---|---|---|
| Rajkowski Joseph M | $324,000 | -- |
Source: Public Records
Mortgage History
| Date | Status | Borrower | Loan Amount |
|---|---|---|---|
| Open | Rajkowski Joseph M | $248,000 | |
| Closed | Rajkowski Joseph M | $158,000 | |
| Closed | Rajkowski Joseph M | $131,700 | |
| Closed | Rajkowski Joseph M | $191,250 |
Source: Public Records
Tax History Compared to Growth
Tax History
| Year | Tax Paid | Tax Assessment Tax Assessment Total Assessment is a certain percentage of the fair market value that is determined by local assessors to be the total taxable value of land and additions on the property. | Land | Improvement |
|---|---|---|---|---|
| 2025 | $12,151 | $1,239,900 | $955,500 | $284,400 |
| 2024 | $11,749 | $1,203,800 | $927,700 | $276,100 |
| 2023 | $11,020 | $1,082,500 | $713,200 | $369,300 |
| 2022 | $10,544 | $1,002,300 | $660,400 | $341,900 |
| 2021 | $10,175 | $945,600 | $623,000 | $322,600 |
| 2020 | $9,872 | $945,600 | $623,000 | $322,600 |
| 2019 | $9,594 | $918,100 | $604,900 | $313,200 |
| 2018 | $9,167 | $847,200 | $549,000 | $298,200 |
| 2017 | $8,887 | $799,200 | $517,900 | $281,300 |
| 2016 | $8,500 | $746,900 | $484,000 | $262,900 |
| 2015 | $8,104 | $698,000 | $452,300 | $245,700 |
Source: Public Records
Map
Nearby Homes
- 35 Haynes Rd
- 21 Philbrick Rd
- 85 Dudley Rd
- 45 Brandeis Rd
- 19 Selwyn Rd
- 628 Boylston St
- 625 Boylston St
- 42 Sunhill Ln
- 136 Dudley Rd
- 671 Boylston St
- 42 Bow Rd
- 5 Halcyon Rd
- 125 Oakdale Rd
- 250 Woodcliff Rd
- 38 Tanglewood Rd
- 79 Florence St Unit 600S
- 79 Florence St Unit 402S
- 20 Hamlet St
- 20 Hamlet St Unit 1
- 36 Cannon St