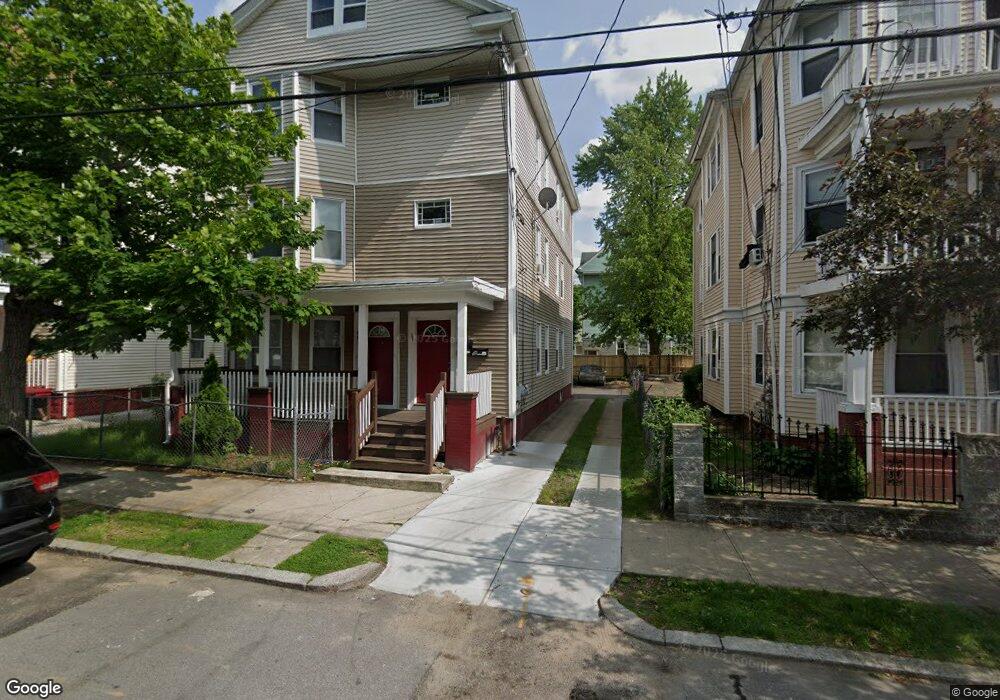
68 Ontario St Providence, RI 02907
Elmwood NeighborhoodEstimated Value: $608,000 - $700,000
9
Beds
3
Baths
3,591
Sq Ft
$181/Sq Ft
Est. Value
About This Home
This home is located at 68 Ontario St, Providence, RI 02907 and is currently estimated at $650,000, approximately $181 per square foot. 68 Ontario St is a home located in Providence County with nearby schools including Asa Messer Elementary School, Charles N. Fortes Elementary School, and Robert L. Bailey IV Elementary.
Ownership History
Date
Name
Owned For
Owner Type
Purchase Details
Closed on
Dec 3, 2014
Sold by
Holland Jennifer
Bought by
Stack Chips Inv Llc
Current Estimated Value
Home Financials for this Owner
Home Financials are based on the most recent Mortgage that was taken out on this home.
Original Mortgage
$70,000
Outstanding Balance
$53,484
Interest Rate
3.93%
Mortgage Type
New Conventional
Estimated Equity
$596,516
Purchase Details
Closed on
Feb 12, 2014
Sold by
Hsbc Bank Usa Na Tr
Bought by
Hsbc Bank Usa Na Tr
Purchase Details
Closed on
Jun 28, 2013
Sold by
Hsbc Bank Usa Na and Narragansett Bay Commi
Bought by
Hsbc Bank Usa Na
Purchase Details
Closed on
Apr 20, 2012
Sold by
Gonsalves Maria and Mtg Pass Through Certi
Bought by
Mtg Pass Through Certi and Hsbc Bank Usa Na Tr
Create a Home Valuation Report for This Property
The Home Valuation Report is an in-depth analysis detailing your home's value as well as a comparison with similar homes in the area
Home Values in the Area
Average Home Value in this Area
Purchase History
| Date | Buyer | Sale Price | Title Company |
|---|---|---|---|
| Stack Chips Inv Llc | -- | -- | |
| Holland Jennifer | $71,325 | -- | |
| Hsbc Bank Usa Na Tr | -- | -- | |
| Hsbc Bank Usa Na | $3,546 | -- | |
| Mtg Pass Through Certi | $75,900 | -- |
Source: Public Records
Mortgage History
| Date | Status | Borrower | Loan Amount |
|---|---|---|---|
| Open | Holland Jennifer | $70,000 | |
| Closed | Stack Chips Inv Llc | $70,000 |
Source: Public Records
Tax History Compared to Growth
Tax History
| Year | Tax Paid | Tax Assessment Tax Assessment Total Assessment is a certain percentage of the fair market value that is determined by local assessors to be the total taxable value of land and additions on the property. | Land | Improvement |
|---|---|---|---|---|
| 2025 | $8,649 | $617,800 | $120,700 | $497,100 |
| 2024 | $7,164 | $390,400 | $52,300 | $338,100 |
| 2023 | $7,164 | $390,400 | $52,300 | $338,100 |
| 2022 | $6,949 | $390,400 | $52,300 | $338,100 |
| 2021 | $6,142 | $250,100 | $37,600 | $212,500 |
| 2020 | $6,142 | $250,100 | $37,600 | $212,500 |
| 2019 | $6,142 | $250,100 | $37,600 | $212,500 |
| 2018 | $4,446 | $139,100 | $25,600 | $113,500 |
| 2017 | $4,446 | $139,100 | $25,600 | $113,500 |
Source: Public Records
Map
Nearby Homes
- 76 Adelaide Ave
- 132 Atlantic Ave
- 33 Adelaide Ave
- 8 Atlantic Ave
- 143 Houston St
- 131 Mitchell St
- 136 Houston St
- 199 Gallup St
- 17 Plum St
- 40 Gladstone St
- 182 Adelaide Ave Unit 3
- 176 Reynolds Ave
- 171 Reynolds Ave
- 154 Gallatin St Unit 156
- 187 Warrington St
- 226 Oxford St
- 118 Moore St
- 98 Sackett St
- 6 Warrington St
- 20 Pennsylvania Ave
- 62 Ontario St
- 66 Ontario St
- 70 Ontario St
- 74 Ontario St
- 71 Lexington Ave
- 75 Lexington Ave
- 121 Niagara St
- 127 Niagara St
- 61 Ontario St
- 65 Ontario St
- 78 Ontario St
- 67 Ontario St Unit 69
- 117 Niagara St
- 89 Lexington Ave
- 75 Ontario St
- 82 Ontario St
- 79 Ontario St
- 113 Niagara St
- 81 Ontario St
- 74 Lexington Ave