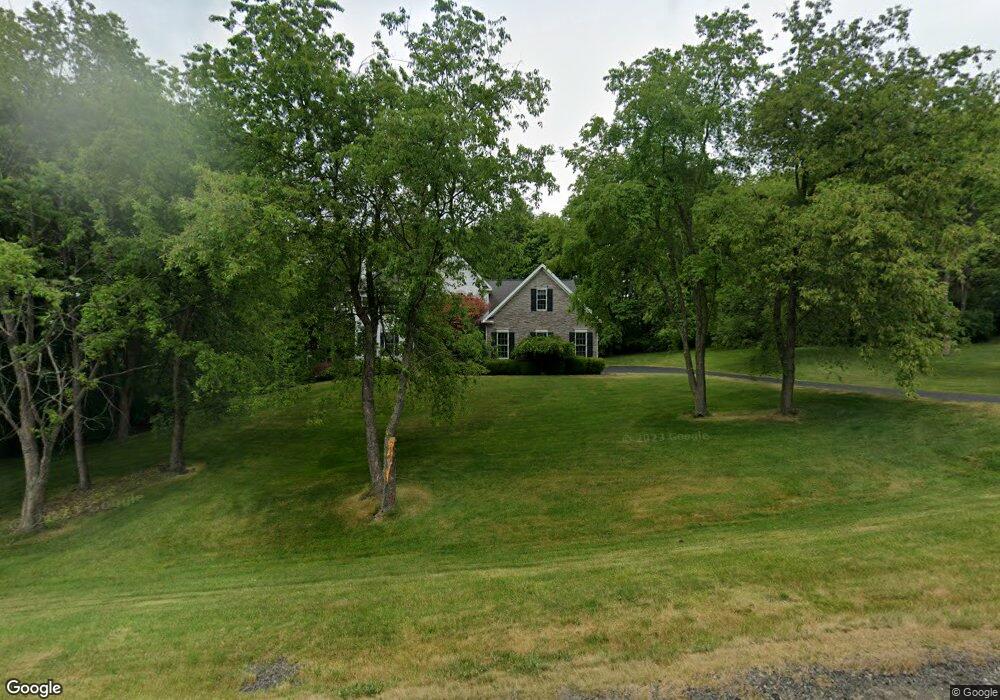
68 Quail Run Elmira, NY 14903
Estimated Value: $632,499 - $699,000
5
Beds
4
Baths
4,400
Sq Ft
$152/Sq Ft
Est. Value
About This Home
This home is located at 68 Quail Run, Elmira, NY 14903 and is currently estimated at $669,833, approximately $152 per square foot. 68 Quail Run is a home located in Chemung County with nearby schools including Big Flats School, Horseheads Middle School, and Horseheads Intermediate School.
Ownership History
Date
Name
Owned For
Owner Type
Purchase Details
Closed on
Jul 5, 2018
Sold by
Macblane Robert C
Bought by
Luciano Anthony Frederi
Current Estimated Value
Home Financials for this Owner
Home Financials are based on the most recent Mortgage that was taken out on this home.
Original Mortgage
$416,000
Outstanding Balance
$242,561
Interest Rate
4.5%
Mortgage Type
Purchase Money Mortgage
Estimated Equity
$427,272
Purchase Details
Closed on
Jun 28, 2018
Sold by
Macblane Robert C and Macblane Barbara A
Bought by
Luciano Anthony F and Bennett-Luciano Megan
Home Financials for this Owner
Home Financials are based on the most recent Mortgage that was taken out on this home.
Original Mortgage
$416,000
Outstanding Balance
$242,561
Interest Rate
4.5%
Mortgage Type
Purchase Money Mortgage
Estimated Equity
$427,272
Purchase Details
Closed on
Oct 5, 2001
Sold by
Klugo Chalres E
Bought by
Macblane Robert C and Macblane Barbara A
Purchase Details
Closed on
Mar 22, 2001
Sold by
Quail Hollow Development Group Inc
Bought by
Klugo Charles E
Create a Home Valuation Report for This Property
The Home Valuation Report is an in-depth analysis detailing your home's value as well as a comparison with similar homes in the area
Home Values in the Area
Average Home Value in this Area
Purchase History
| Date | Buyer | Sale Price | Title Company |
|---|---|---|---|
| Luciano Anthony Frederi | $520,000 | -- | |
| Luciano Anthony F | $520,000 | -- | |
| Macblane Robert C | $330,000 | Steven E Agan | |
| -- | -- | -- | |
| Klugo Charles E | $70,000 | Scott J Pautz |
Source: Public Records
Mortgage History
| Date | Status | Borrower | Loan Amount |
|---|---|---|---|
| Open | Luciano Anthony Frederi | $416,000 | |
| Closed | Luciano Anthony F | $416,000 |
Source: Public Records
Tax History Compared to Growth
Tax History
| Year | Tax Paid | Tax Assessment Tax Assessment Total Assessment is a certain percentage of the fair market value that is determined by local assessors to be the total taxable value of land and additions on the property. | Land | Improvement |
|---|---|---|---|---|
| 2024 | $16,363 | $599,800 | $106,800 | $493,000 |
| 2023 | $15,223 | $555,300 | $98,800 | $456,500 |
| 2022 | $15,670 | $555,300 | $98,800 | $456,500 |
| 2021 | $15,032 | $523,900 | $95,900 | $428,000 |
| 2020 | $14,584 | $476,300 | $91,374 | $384,926 |
| 2019 | $5,420 | $476,300 | $91,374 | $384,926 |
| 2018 | $13,983 | $476,300 | $91,374 | $384,926 |
| 2017 | $14,226 | $476,300 | $91,374 | $384,926 |
| 2016 | $14,117 | $476,300 | $91,374 | $384,926 |
| 2015 | -- | $476,300 | $91,374 | $384,926 |
| 2014 | -- | $476,300 | $104,800 | $371,500 |
Source: Public Records
Map
Nearby Homes
- 00 Cr-64 Lot C
- 00 Cr-64 Lot D
- 1 Woodsview Dr
- 888 Harris Hill Rd
- 33 Suburban Dr
- 29 Suburban Dr
- 30 Suburban Dr
- 524 County Road 64
- 0 Valley View Dr
- 208 County Road 64
- 180 Hibbard Rd
- 21 Algonquin Dr
- 865 W Hill Rd
- 2 Maple Rd
- 0 Canal St
- 270 W Hill Road A
- 227 Hibbard Rd
- 11 Lloyd Dr
- 42 Sing Rd
- 23 Chestnut St