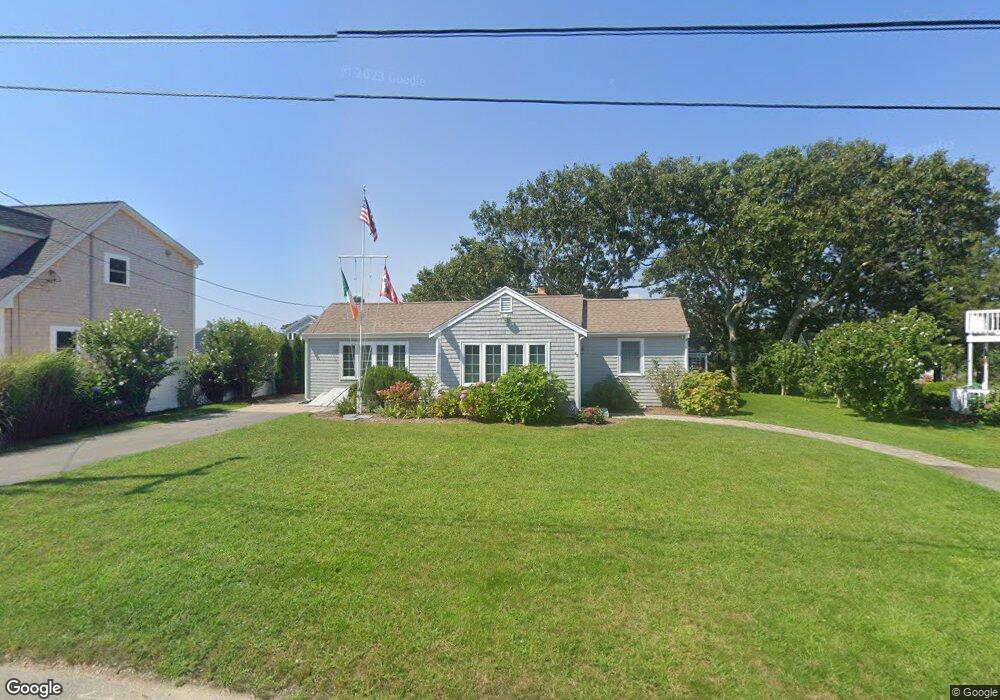
68 Rope Walk Rd Bourne, MA 2532
Estimated Value: $848,000 - $1,085,000
3
Beds
3
Baths
1,236
Sq Ft
$773/Sq Ft
Est. Value
About This Home
This home is located at 68 Rope Walk Rd, Bourne, MA 2532 and is currently estimated at $955,156, approximately $772 per square foot. 68 Rope Walk Rd is a home located in Barnstable County with nearby schools including Bourne High School.
Ownership History
Date
Name
Owned For
Owner Type
Purchase Details
Closed on
Sep 22, 2023
Sold by
Lynch James
Bought by
James A Lynch Ret and Lynch
Current Estimated Value
Purchase Details
Closed on
Sep 27, 2021
Sold by
Beverly S Rosen Lt and Hirsch
Bought by
Hirsch John F and Hirsch Susan R
Purchase Details
Closed on
Sep 15, 2021
Sold by
Hirsch Ft 2004 and Hirsch
Bought by
Lynch James
Purchase Details
Closed on
Dec 30, 2013
Sold by
Hirsch John F and Hirsch Susan R
Bought by
Hirch Ft and Hirsch
Purchase Details
Closed on
May 11, 2011
Sold by
Beverly S Rosen Lt and Hirsch
Bought by
Hirsch John F and Hirsch Susan R
Home Financials for this Owner
Home Financials are based on the most recent Mortgage that was taken out on this home.
Original Mortgage
$250,000
Interest Rate
4.88%
Purchase Details
Closed on
Feb 25, 2011
Sold by
Beverly S Rosen Lt and Hirsch
Bought by
Hirsch John F and Hirsch Susan R
Purchase Details
Closed on
Jul 7, 2010
Sold by
Ryan Kevin W and Ryan Mary Ellen
Bought by
Beverly S Rosen Lt and Rosen
Create a Home Valuation Report for This Property
The Home Valuation Report is an in-depth analysis detailing your home's value as well as a comparison with similar homes in the area
Purchase History
| Date | Buyer | Sale Price | Title Company |
|---|---|---|---|
| James A Lynch Ret | -- | None Available | |
| James A Lynch Ret | -- | None Available | |
| Hirsch John F | -- | None Available | |
| Hirsch John F | -- | None Available | |
| Lynch James | $755,000 | None Available | |
| Lynch James | $755,000 | None Available | |
| Hirch Ft | -- | -- | |
| Hirch Ft | -- | -- | |
| Hirsch John F | -- | -- | |
| Hirsch John F | -- | -- | |
| Hirsch John F | -- | -- | |
| Hirsch John F | -- | -- | |
| Beverly S Rosen Lt | -- | -- | |
| Beverly S Rosen Lt | -- | -- |
Source: Public Records
Mortgage History
| Date | Status | Borrower | Loan Amount |
|---|---|---|---|
| Previous Owner | Beverly S Rosen Lt | $250,000 |
Source: Public Records
Tax History
| Year | Tax Paid | Tax Assessment Tax Assessment Total Assessment is a certain percentage of the fair market value that is determined by local assessors to be the total taxable value of land and additions on the property. | Land | Improvement |
|---|---|---|---|---|
| 2025 | $6,171 | $790,100 | $524,100 | $266,000 |
| 2024 | $6,033 | $752,300 | $499,100 | $253,200 |
| 2023 | $5,348 | $607,000 | $441,700 | $165,300 |
| 2022 | $4,627 | $458,600 | $325,800 | $132,800 |
| 2021 | $4,486 | $416,500 | $296,500 | $120,000 |
| 2020 | $4,380 | $407,800 | $293,600 | $114,200 |
| 2019 | $4,219 | $401,400 | $293,600 | $107,800 |
| 2018 | $3,974 | $377,000 | $279,700 | $97,300 |
| 2017 | $4,135 | $401,500 | $310,300 | $91,200 |
| 2016 | $4,060 | $399,600 | $310,300 | $89,300 |
| 2015 | $4,406 | $437,500 | $360,200 | $77,300 |
Source: Public Records
Map
Nearby Homes
- 248 Great Neck Rd
- 566 Shore Rd
- 35 Benedict Rd
- 14 Navajo Rd
- 200 Great Neck Rd
- 60 Bourne Neck Dr
- 203 County Rd
- 36B Starboard Dr Unit 36E
- 36B Starboard Dr Unit 36G
- 36B Starboard Dr Unit 36C
- 36B Starboard Dr Unit 36A
- 36B Starboard Dr Unit 36D
- 36B Starboard Dr Unit 36B
- 36B Starboard Dr Unit 36F
- 36B Starboard Dr Unit 36H
- 3 Carleton St Unit 3
- 23 Starboard Dr Unit Lot 50
- 32 Carleton St Unit 32
- 254 Barlows Landing Rd
- 10 East Blvd
- 68 Rope Walk Rd
- 70 Rope Walk Rd
- 70 Rope Walk Rd
- 66 Rope Walk Rd
- 67 Wianno Rd
- 67 Wianno Rd
- 69 Wianno Rd
- 102 Rope Walk Rd
- 65 Mooring Rd
- 65 Wianno Rd
- 104 Rope Walk
- 104 Rope Walk Rd
- 104 Rope Walk Rd
- 72 Rope Walk Rd
- 71 Wianno Rd
- 100 Rope Walk Rd
- 106 Rope Walk Rd
- 106 Rope Walk Rd
- 106 Rope Walk Rd Unit 106
- 64 Rope Walk Rd
Your Personal Tour Guide
Ask me questions while you tour the home.