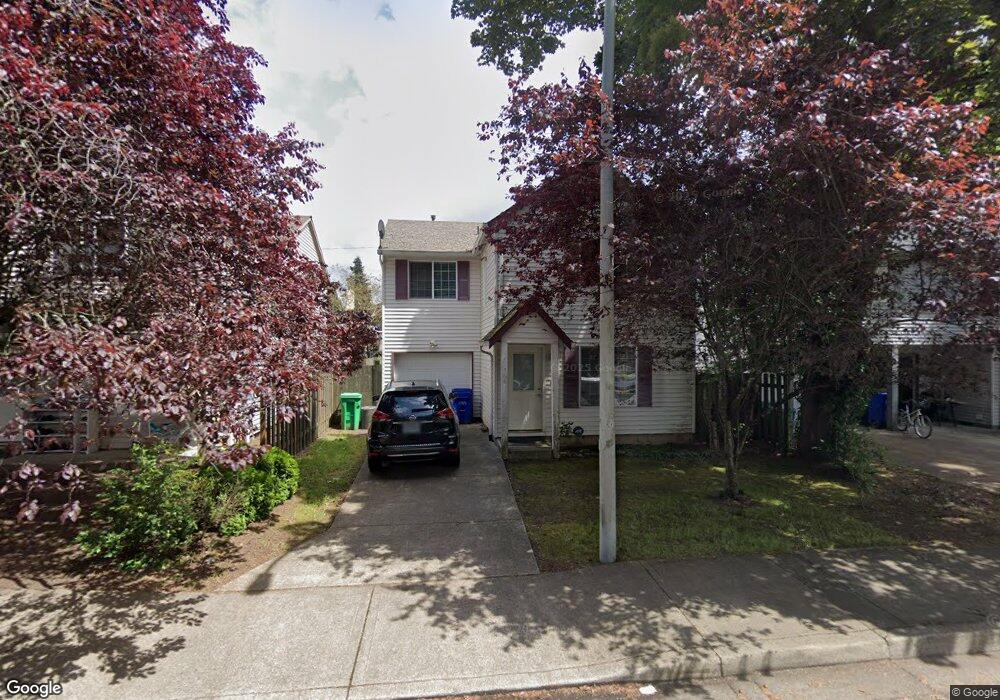
68 SE 165th Ave Portland, OR 97233
Rockwood NeighborhoodEstimated Value: $360,000 - $391,000
3
Beds
3
Baths
1,308
Sq Ft
$289/Sq Ft
Est. Value
About This Home
This home is located at 68 SE 165th Ave, Portland, OR 97233 and is currently estimated at $378,524, approximately $289 per square foot. 68 SE 165th Ave is a home located in Multnomah County with nearby schools including Alder Elementary School, Hauton B Lee Middle School, and Reynolds High School.
Ownership History
Date
Name
Owned For
Owner Type
Purchase Details
Closed on
May 5, 2009
Sold by
Tadesse Gelila W
Bought by
Amine Sara G
Current Estimated Value
Home Financials for this Owner
Home Financials are based on the most recent Mortgage that was taken out on this home.
Original Mortgage
$144,000
Outstanding Balance
$90,737
Interest Rate
4.8%
Mortgage Type
Purchase Money Mortgage
Estimated Equity
$287,787
Purchase Details
Closed on
Apr 20, 2005
Sold by
Sayenko Victor A
Bought by
Amine Sara G and Tadesse Gelila W
Home Financials for this Owner
Home Financials are based on the most recent Mortgage that was taken out on this home.
Original Mortgage
$132,621
Interest Rate
5.84%
Mortgage Type
Purchase Money Mortgage
Purchase Details
Closed on
Mar 15, 2002
Sold by
B W Construction Inc
Bought by
Sayenko Victor A
Home Financials for this Owner
Home Financials are based on the most recent Mortgage that was taken out on this home.
Original Mortgage
$116,910
Interest Rate
6.99%
Mortgage Type
Purchase Money Mortgage
Create a Home Valuation Report for This Property
The Home Valuation Report is an in-depth analysis detailing your home's value as well as a comparison with similar homes in the area
Home Values in the Area
Average Home Value in this Area
Purchase History
| Date | Buyer | Sale Price | Title Company |
|---|---|---|---|
| Amine Sara G | -- | Ticor Title | |
| Amine Sara G | $165,777 | First American | |
| Sayenko Victor A | $129,900 | Fidelity National Title Co |
Source: Public Records
Mortgage History
| Date | Status | Borrower | Loan Amount |
|---|---|---|---|
| Open | Amine Sara G | $144,000 | |
| Previous Owner | Amine Sara G | $132,621 | |
| Previous Owner | Sayenko Victor A | $116,910 | |
| Closed | Amine Sara G | $33,155 |
Source: Public Records
Tax History Compared to Growth
Tax History
| Year | Tax Paid | Tax Assessment Tax Assessment Total Assessment is a certain percentage of the fair market value that is determined by local assessors to be the total taxable value of land and additions on the property. | Land | Improvement |
|---|---|---|---|---|
| 2024 | $3,302 | $176,560 | -- | -- |
| 2023 | $2,988 | $171,420 | $0 | $0 |
| 2022 | $2,914 | $166,430 | $0 | $0 |
| 2021 | $2,842 | $161,590 | $0 | $0 |
| 2020 | $2,659 | $156,890 | $0 | $0 |
| 2019 | $2,549 | $152,330 | $0 | $0 |
| 2018 | $2,523 | $147,900 | $0 | $0 |
| 2017 | $2,442 | $143,600 | $0 | $0 |
| 2016 | $2,336 | $139,420 | $0 | $0 |
| 2015 | $2,268 | $135,360 | $0 | $0 |
| 2014 | $2,192 | $131,420 | $0 | $0 |
Source: Public Records
Map
Nearby Homes
- 16646 SE Ankeny St
- 16715 E Burnside St
- 165 NE 167th Place
- 202 NE 162nd Ave
- 275 SE 162nd Ave Unit 309
- 281 SE 162nd Ave Unit 105
- 16515 NE Everett Ct
- 61 SE 171st Ave
- 20 SE 172nd Ave Unit 118
- 17310 E Burnside St
- 16230 NE Hoyt St
- 15725 SE Stark St
- 15645 E Burnside St Unit 15647
- 226 NE 157th Ave
- 707 SE 160th Ave
- 16317 SE Salmon St Unit B
- 15590 E Burnside St
- 15557 E Burnside St
- 401 NE 157th Ave
- 236 NE 156th Ave Unit A & B
- 52 SE 165th Ave
- 84 SE 165th Ave
- 36 SE 165th Ave
- 16510 E Burnside St Unit 16512
- 16520 E Burnside St
- 101 SE 165th Ave
- 16536 E Burnside St
- 16516 E Burnside St Unit 16536
- 16530 SE Ankeny St
- 127 SE 165th Ave
- 105 SE 165th Ave
- 220 SE 165th Ave
- 121 SE 166th Ave
- 16601 SE Ankeny St
- 16600 E Burnside St Unit 16602
- 16602 E Burnside St
- 123 SE 165th Ave
- 109 SE 165th Ave
- 205 SE 166th Ave
- 110 SE 166th Ave