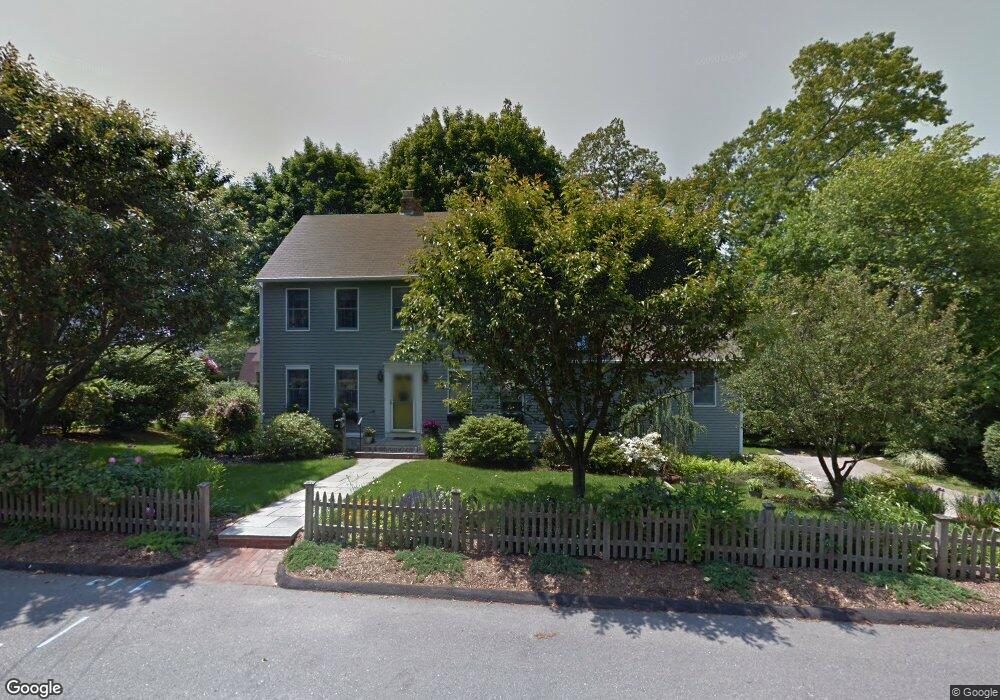
68 Summer St Westerly, RI 02891
Estimated Value: $647,000 - $781,650
3
Beds
3
Baths
2,859
Sq Ft
$245/Sq Ft
Est. Value
About This Home
This home is located at 68 Summer St, Westerly, RI 02891 and is currently estimated at $699,663, approximately $244 per square foot. 68 Summer St is a home located in Washington County with nearby schools including Westerly High School and St. Michael School.
Ownership History
Date
Name
Owned For
Owner Type
Purchase Details
Closed on
Jul 20, 2016
Sold by
Rutan Beverly T
Bought by
Lord Clayton A
Current Estimated Value
Home Financials for this Owner
Home Financials are based on the most recent Mortgage that was taken out on this home.
Original Mortgage
$306,000
Outstanding Balance
$241,794
Interest Rate
3.6%
Mortgage Type
Purchase Money Mortgage
Estimated Equity
$457,869
Purchase Details
Closed on
Aug 15, 2002
Sold by
Murdock David E and Murdock Colleen M
Bought by
Rutan Frank and Rutan Beverly T
Purchase Details
Closed on
Nov 13, 1995
Sold by
Smith Wesley A and Smith Donna
Bought by
Murdock David E and Murdock Colleen
Create a Home Valuation Report for This Property
The Home Valuation Report is an in-depth analysis detailing your home's value as well as a comparison with similar homes in the area
Home Values in the Area
Average Home Value in this Area
Purchase History
| Date | Buyer | Sale Price | Title Company |
|---|---|---|---|
| Lord Clayton A | $340,000 | -- | |
| Rutan Frank | $290,000 | -- | |
| Murdock David E | $165,000 | -- |
Source: Public Records
Mortgage History
| Date | Status | Borrower | Loan Amount |
|---|---|---|---|
| Open | Lord Clayton A | $306,000 | |
| Previous Owner | Murdock David E | $68,000 | |
| Previous Owner | Murdock David E | $146,598 | |
| Previous Owner | Murdock David E | $40,000 |
Source: Public Records
Tax History
| Year | Tax Paid | Tax Assessment Tax Assessment Total Assessment is a certain percentage of the fair market value that is determined by local assessors to be the total taxable value of land and additions on the property. | Land | Improvement |
|---|---|---|---|---|
| 2025 | $4,704 | $604,600 | $161,700 | $442,900 |
| 2024 | $4,902 | $469,100 | $116,200 | $352,900 |
| 2023 | $4,766 | $469,100 | $116,200 | $352,900 |
| 2022 | $4,738 | $469,100 | $116,200 | $352,900 |
| 2021 | $4,778 | $396,200 | $101,300 | $294,900 |
| 2020 | $4,695 | $396,200 | $101,300 | $294,900 |
| 2019 | $4,651 | $396,200 | $101,300 | $294,900 |
| 2018 | $4,208 | $340,700 | $101,300 | $239,400 |
| 2017 | $4,088 | $340,700 | $101,300 | $239,400 |
| 2016 | $4,088 | $340,700 | $101,300 | $239,400 |
| 2015 | $3,856 | $343,400 | $103,300 | $240,100 |
| 2014 | $3,435 | $343,400 | $103,300 | $240,100 |
Source: Public Records
Map
Nearby Homes
- 28 Spruce St
- 52 Spruce St
- 2 Gravity Ct
- 21 Linden St
- 145 High St Unit D
- 140 High St Unit 307
- 12 Canal St Unit 205
- 40 Pleasant St
- 55 Pleasant St
- 5 Marion St
- 25 School St Unit 2
- 12 Batterson Ave
- 24 George St
- 2 Marichris Dr
- 77 Mechanic St
- 9 Perkins Ave
- 141 W Broad St
- 22 Colonial Dr
- 15 Moss St
- 1 River St
Your Personal Tour Guide
Ask me questions while you tour the home.