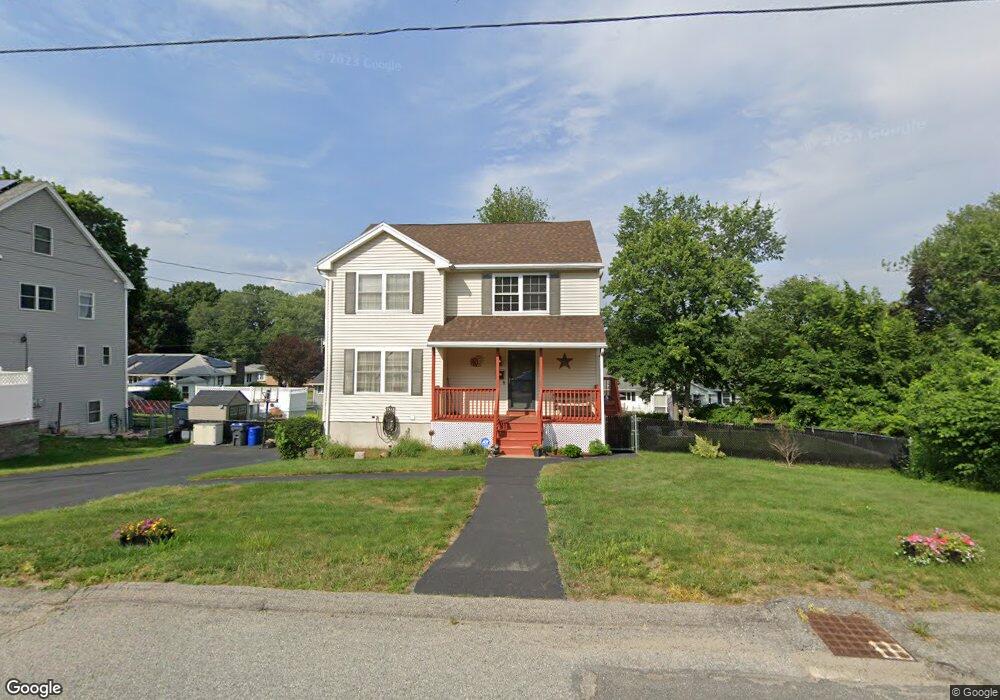
68 Swan Ave Methuen, MA 01844
The East End NeighborhoodEstimated Value: $534,000 - $596,000
3
Beds
2
Baths
1,488
Sq Ft
$380/Sq Ft
Est. Value
About This Home
This home is located at 68 Swan Ave, Methuen, MA 01844 and is currently estimated at $564,863, approximately $379 per square foot. 68 Swan Ave is a home located in Essex County with nearby schools including Timony Grammar School, South Point Elementary School, and Methuen High School.
Ownership History
Date
Name
Owned For
Owner Type
Purchase Details
Closed on
Nov 9, 2006
Sold by
Solano Viola S
Bought by
Monroy Byron and Monroy Claribel
Current Estimated Value
Home Financials for this Owner
Home Financials are based on the most recent Mortgage that was taken out on this home.
Original Mortgage
$244,000
Outstanding Balance
$145,138
Interest Rate
6.31%
Mortgage Type
Purchase Money Mortgage
Estimated Equity
$419,725
Purchase Details
Closed on
Mar 30, 2001
Sold by
Ynfante Cristino and Ynfante Maria J
Bought by
Solano Viola S
Home Financials for this Owner
Home Financials are based on the most recent Mortgage that was taken out on this home.
Original Mortgage
$30,000
Interest Rate
6.96%
Mortgage Type
Purchase Money Mortgage
Purchase Details
Closed on
Nov 4, 1999
Sold by
Tarshi James M
Bought by
Ynfante Cristino and Ynfante Maria J
Purchase Details
Closed on
Apr 16, 1999
Sold by
Tarshi James M
Bought by
Tarshi Irene V
Create a Home Valuation Report for This Property
The Home Valuation Report is an in-depth analysis detailing your home's value as well as a comparison with similar homes in the area
Home Values in the Area
Average Home Value in this Area
Purchase History
| Date | Buyer | Sale Price | Title Company |
|---|---|---|---|
| Monroy Byron | $305,000 | -- | |
| Monroy Byron | $305,000 | -- | |
| Solano Viola S | $228,500 | -- | |
| Solano Viola S | $228,500 | -- | |
| Ynfante Cristino | $184,900 | -- | |
| Ynfante Cristino | $184,900 | -- | |
| Tarshi Irene V | $50,000 | -- | |
| Tarshi Irene V | $50,000 | -- |
Source: Public Records
Mortgage History
| Date | Status | Borrower | Loan Amount |
|---|---|---|---|
| Open | Monroy Byron | $244,000 | |
| Closed | Monroy Byron | $61,000 | |
| Closed | Tarshi Irene V | $244,000 | |
| Previous Owner | Tarshi Irene V | $30,000 |
Source: Public Records
Tax History Compared to Growth
Tax History
| Year | Tax Paid | Tax Assessment Tax Assessment Total Assessment is a certain percentage of the fair market value that is determined by local assessors to be the total taxable value of land and additions on the property. | Land | Improvement |
|---|---|---|---|---|
| 2025 | $4,658 | $440,300 | $135,800 | $304,500 |
| 2024 | $4,670 | $430,000 | $123,900 | $306,100 |
| 2023 | $4,476 | $382,600 | $110,100 | $272,500 |
| 2022 | $4,244 | $325,200 | $91,700 | $233,500 |
| 2021 | $3,983 | $302,000 | $87,200 | $214,800 |
| 2020 | $3,934 | $292,700 | $87,200 | $205,500 |
| 2019 | $3,787 | $266,900 | $78,000 | $188,900 |
| 2018 | $3,673 | $257,400 | $78,000 | $179,400 |
| 2017 | $3,537 | $241,400 | $78,000 | $163,400 |
| 2016 | $3,460 | $233,600 | $73,400 | $160,200 |
| 2015 | $3,317 | $227,200 | $73,400 | $153,800 |
Source: Public Records
Map
Nearby Homes
- 9 Boylston St
- 35 Swan Ave
- 68 Wesley St
- 24 Boylston St
- 167 Ferry 53 Mann St Unit 2,5,6
- 15 Swan Ave
- 24 Court St
- 106 Leroy Ave
- 35 Kendall St
- 29 Meadowbrook Rd
- 262 E Haverhill St Unit 4
- 20 Knox St Unit 43
- 20 Knox St Unit 23
- 63 Lippold St
- 4 Alderbrook Ln
- 3 Thissell St
- 5 Harmony Ln
- 100-102 E Haverhill St
- 80 Ferry St Unit 80A
- 65 Brook St