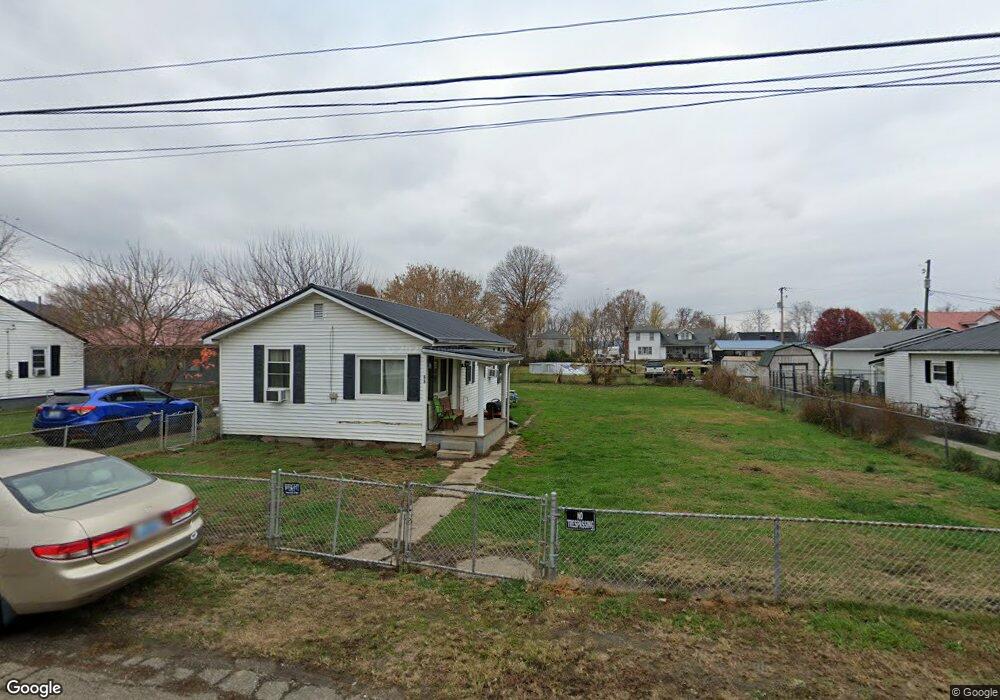
68 W 2nd Ave South Shore, KY 41175
Estimated Value: $41,000 - $127,000
2
Beds
1
Bath
900
Sq Ft
$81/Sq Ft
Est. Value
About This Home
This home is located at 68 W 2nd Ave, South Shore, KY 41175 and is currently estimated at $73,322, approximately $81 per square foot. 68 W 2nd Ave is a home located in Greenup County with nearby schools including Greenup County High School, Notre Dame Elementary School, and Portsmouth Stem Academy.
Ownership History
Date
Name
Owned For
Owner Type
Purchase Details
Closed on
Jan 19, 2010
Sold by
Hall Gary and Hall Linda Jean
Bought by
Sullivan Steven R
Current Estimated Value
Home Financials for this Owner
Home Financials are based on the most recent Mortgage that was taken out on this home.
Original Mortgage
$41,140
Outstanding Balance
$27,980
Interest Rate
5.75%
Mortgage Type
FHA
Estimated Equity
$45,342
Create a Home Valuation Report for This Property
The Home Valuation Report is an in-depth analysis detailing your home's value as well as a comparison with similar homes in the area
Home Values in the Area
Average Home Value in this Area
Purchase History
| Date | Buyer | Sale Price | Title Company |
|---|---|---|---|
| Sullivan Steven R | $41,900 | -- |
Source: Public Records
Mortgage History
| Date | Status | Borrower | Loan Amount |
|---|---|---|---|
| Open | Sullivan Steven R | $41,140 |
Source: Public Records
Tax History Compared to Growth
Tax History
| Year | Tax Paid | Tax Assessment Tax Assessment Total Assessment is a certain percentage of the fair market value that is determined by local assessors to be the total taxable value of land and additions on the property. | Land | Improvement |
|---|---|---|---|---|
| 2025 | $790 | $40,000 | $10,000 | $30,000 |
| 2024 | $786 | $40,000 | $10,000 | $30,000 |
| 2023 | $746 | $40,000 | $10,000 | $30,000 |
| 2022 | $728 | $40,000 | $10,000 | $30,000 |
| 2021 | $724 | $40,000 | $10,000 | $30,000 |
| 2020 | $702 | $40,000 | $10,000 | $30,000 |
| 2019 | $730 | $40,000 | $10,000 | $30,000 |
| 2018 | $783 | $41,900 | $10,000 | $31,900 |
| 2017 | $749 | $41,900 | $10,000 | $31,900 |
| 2016 | $749 | $41,900 | $10,000 | $31,900 |
| 2015 | $741 | $41,900 | $10,000 | $31,900 |
| 2014 | $730 | $41,900 | $10,000 | $31,900 |
| 2011 | -- | $41,900 | $10,000 | $31,900 |
Source: Public Records
Map
Nearby Homes