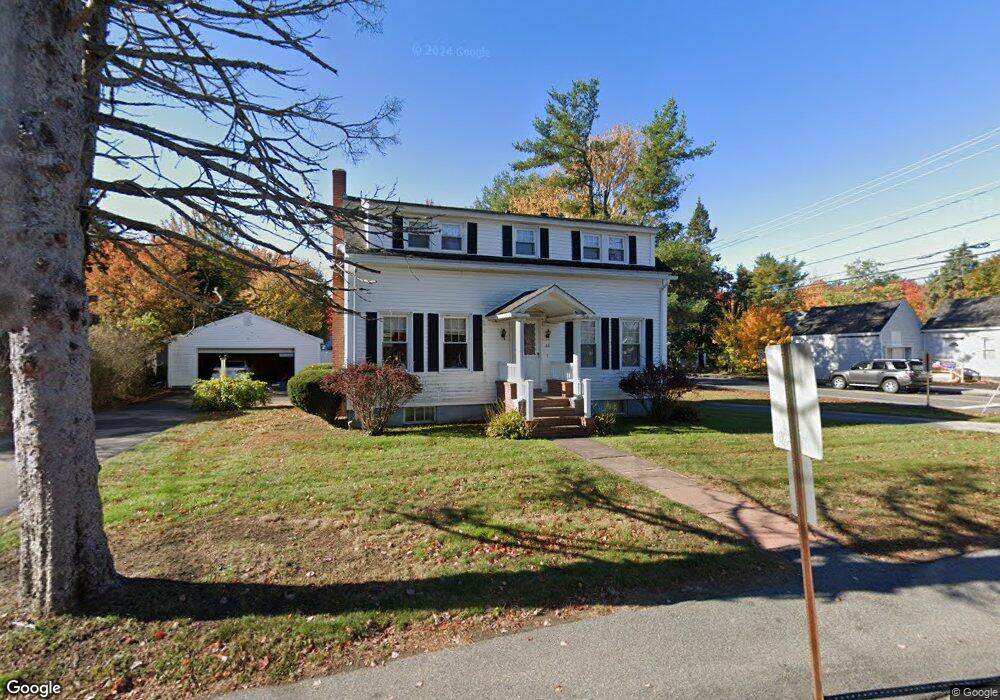
68 West St Biddeford, ME 04005
Estimated Value: $406,000 - $448,000
4
Beds
1
Bath
1,446
Sq Ft
$300/Sq Ft
Est. Value
About This Home
This home is located at 68 West St, Biddeford, ME 04005 and is currently estimated at $434,367, approximately $300 per square foot. 68 West St is a home located in York County with nearby schools including John F Kennedy Memorial School, Biddeford Primary School, and Biddeford Intermediate School.
Ownership History
Date
Name
Owned For
Owner Type
Purchase Details
Closed on
Dec 1, 2011
Sold by
Davis Stella L
Bought by
Paquet Nicole J
Current Estimated Value
Home Financials for this Owner
Home Financials are based on the most recent Mortgage that was taken out on this home.
Original Mortgage
$127,551
Outstanding Balance
$86,034
Interest Rate
4.1%
Mortgage Type
Purchase Money Mortgage
Estimated Equity
$348,333
Purchase Details
Closed on
Jan 22, 2007
Sold by
Wright Mark and Wright Terri
Bought by
Landamerica Onestop Inc T
Create a Home Valuation Report for This Property
The Home Valuation Report is an in-depth analysis detailing your home's value as well as a comparison with similar homes in the area
Home Values in the Area
Average Home Value in this Area
Purchase History
| Date | Buyer | Sale Price | Title Company |
|---|---|---|---|
| Paquet Nicole J | -- | -- | |
| Landamerica Onestop Inc T | -- | -- |
Source: Public Records
Mortgage History
| Date | Status | Borrower | Loan Amount |
|---|---|---|---|
| Open | Paquet Nicole J | $127,551 |
Source: Public Records
Tax History
| Year | Tax Paid | Tax Assessment Tax Assessment Total Assessment is a certain percentage of the fair market value that is determined by local assessors to be the total taxable value of land and additions on the property. | Land | Improvement |
|---|---|---|---|---|
| 2025 | $5,090 | $340,700 | $165,200 | $175,500 |
| 2024 | $4,798 | $337,400 | $165,200 | $172,200 |
| 2023 | $4,389 | $334,500 | $162,300 | $172,200 |
| 2022 | $3,871 | $235,900 | $91,200 | $144,700 |
| 2021 | $3,668 | $201,200 | $77,200 | $124,000 |
| 2020 | $3,721 | $185,600 | $70,100 | $115,500 |
| 2019 | $3,708 | $185,600 | $70,100 | $115,500 |
| 2018 | $2,360 | $185,600 | $70,100 | $115,500 |
| 2017 | $2,142 | $177,100 | $70,100 | $107,000 |
| 2016 | $3,517 | $177,100 | $70,100 | $107,000 |
| 2015 | $3,448 | $177,100 | $70,100 | $107,000 |
| 2014 | $3,363 | $177,100 | $70,100 | $107,000 |
| 2013 | -- | $182,000 | $62,800 | $119,200 |
Source: Public Records
Map
Nearby Homes
Your Personal Tour Guide
Ask me questions while you tour the home.