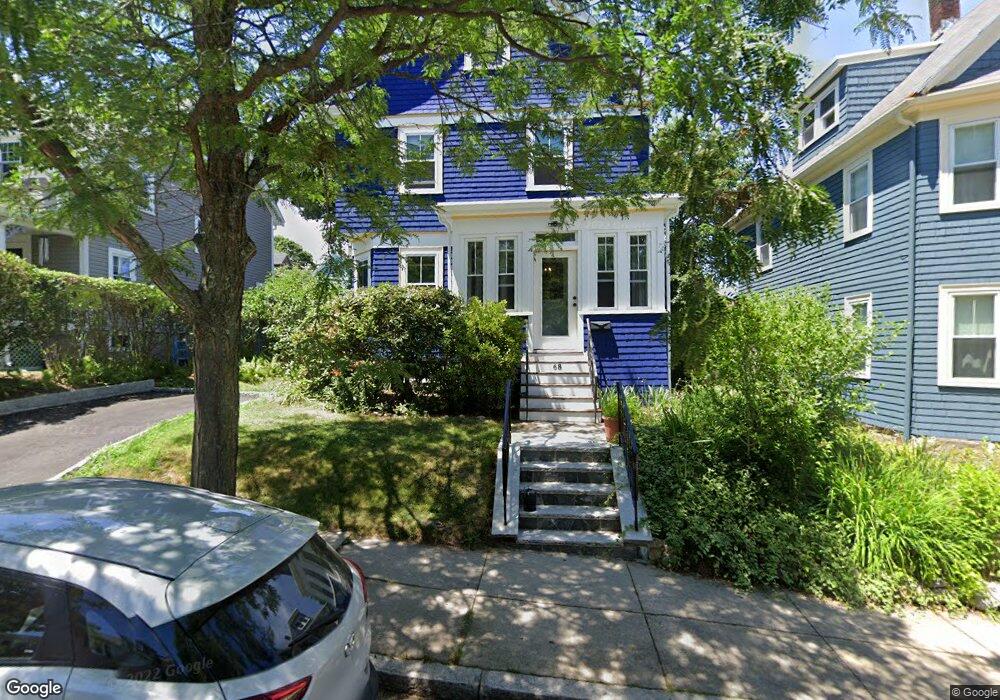
68 Westbourne St Roslindale, MA 02131
Roslindale NeighborhoodEstimated Value: $896,607 - $1,048,000
4
Beds
2
Baths
1,803
Sq Ft
$534/Sq Ft
Est. Value
About This Home
This home is located at 68 Westbourne St, Roslindale, MA 02131 and is currently estimated at $961,902, approximately $533 per square foot. 68 Westbourne St is a home located in Suffolk County with nearby schools including Holy Name Parish School and Sacred Heart STEM School.
Ownership History
Date
Name
Owned For
Owner Type
Purchase Details
Closed on
Feb 12, 2004
Sold by
Whelan Marguerite C
Bought by
Munnelly Michael O and Munnelly Aimee H
Current Estimated Value
Home Financials for this Owner
Home Financials are based on the most recent Mortgage that was taken out on this home.
Original Mortgage
$260,000
Interest Rate
5.82%
Mortgage Type
Purchase Money Mortgage
Create a Home Valuation Report for This Property
The Home Valuation Report is an in-depth analysis detailing your home's value as well as a comparison with similar homes in the area
Home Values in the Area
Average Home Value in this Area
Purchase History
| Date | Buyer | Sale Price | Title Company |
|---|---|---|---|
| Munnelly Michael O | $358,500 | -- |
Source: Public Records
Mortgage History
| Date | Status | Borrower | Loan Amount |
|---|---|---|---|
| Open | Munnelly Michael O | $233,000 | |
| Closed | Munnelly Michael O | $4,000 | |
| Closed | Munnelly Michael O | $260,000 |
Source: Public Records
Tax History Compared to Growth
Tax History
| Year | Tax Paid | Tax Assessment Tax Assessment Total Assessment is a certain percentage of the fair market value that is determined by local assessors to be the total taxable value of land and additions on the property. | Land | Improvement |
|---|---|---|---|---|
| 2025 | $8,466 | $731,100 | $263,100 | $468,000 |
| 2024 | $8,105 | $743,600 | $266,900 | $476,700 |
| 2023 | $7,606 | $708,200 | $254,200 | $454,000 |
| 2022 | $6,879 | $632,300 | $227,000 | $405,300 |
| 2021 | $6,233 | $584,200 | $216,100 | $368,100 |
| 2020 | $5,967 | $565,100 | $191,500 | $373,600 |
| 2019 | $5,544 | $526,000 | $155,400 | $370,600 |
| 2018 | $5,105 | $487,100 | $155,400 | $331,700 |
| 2017 | $4,822 | $455,300 | $155,400 | $299,900 |
| 2016 | $4,862 | $442,000 | $155,400 | $286,600 |
| 2015 | $4,851 | $400,600 | $135,800 | $264,800 |
| 2014 | $4,331 | $344,300 | $135,800 | $208,500 |
Source: Public Records
Map
Nearby Homes
- 105 Orange St
- 59 Aldrich St Unit 2
- 43 Aldrich St
- 40 Newburg St Unit 1
- 150 Aldrich St
- 276 Cornell St
- 242 Belgrade Ave
- 15 Newburg St Unit 1
- 34 Averton St
- 257 Belgrade Ave
- 37 Montvale St Unit 2
- 311 Belgrade Ave
- 142 Birch St
- 142 Birch St Unit 2
- 142 Birch St Unit 1
- 80 Roslindale Ave Unit 3
- 70 Robin St
- 103 Belgrade Ave Unit 2
- 6 Hayes Rd Unit 16
- 52 Metropolitan Ave Unit 3
- 64 Westbourne St
- 72 Westbourne St
- 372 Cornell St
- 372 Cornell St Unit 3
- 372 Cornell St Unit 2
- 76 Westbourne St
- 118 Newburg St
- 60 Westbourne St
- 122 Newburg St
- 110 Newburg St
- 65 Westbourne St
- 69 Westbourne St
- 126 Newburg St
- 56 Westbourne St
- 73 Westbourne St
- 73 Westbourne St Unit 1
- 61 Westbourne St
- 359 Cornell St
- 130 Newburg St
- 361-363 Cornell St